

doi: 10.1128/JVI.01445-09.
Epub 2009 Oct 7.
Effects of acute and chronic murine norovirus infections on immune responses and recovery from Friend retrovirus infection
Affiliations
- PMID: 19812147
- PMCID: PMC2786825
- DOI: 10.1128/JVI.01445-09
Item in Clipboard
Effects of acute and chronic murine norovirus infections on immune responses and recovery from Friend retrovirus infection
J Virol.
2009 Dec.
Abstract
Murine norovirus (MNV) is a highly infectious but generally nonpathogenic agent that is commonly found in research mouse colonies in both North America and Europe. In the present study, the effects of acute and chronic infections with MNV on immune responses and recovery from concurrent Friend virus (FV) infections were investigated. No significant differences in T-cell or NK-cell responses, FV-neutralizing antibody responses, or long-term recovery from FV infection were observed. We conclude that concurrent MNV infections had no major impacts on FV infections.
Figures
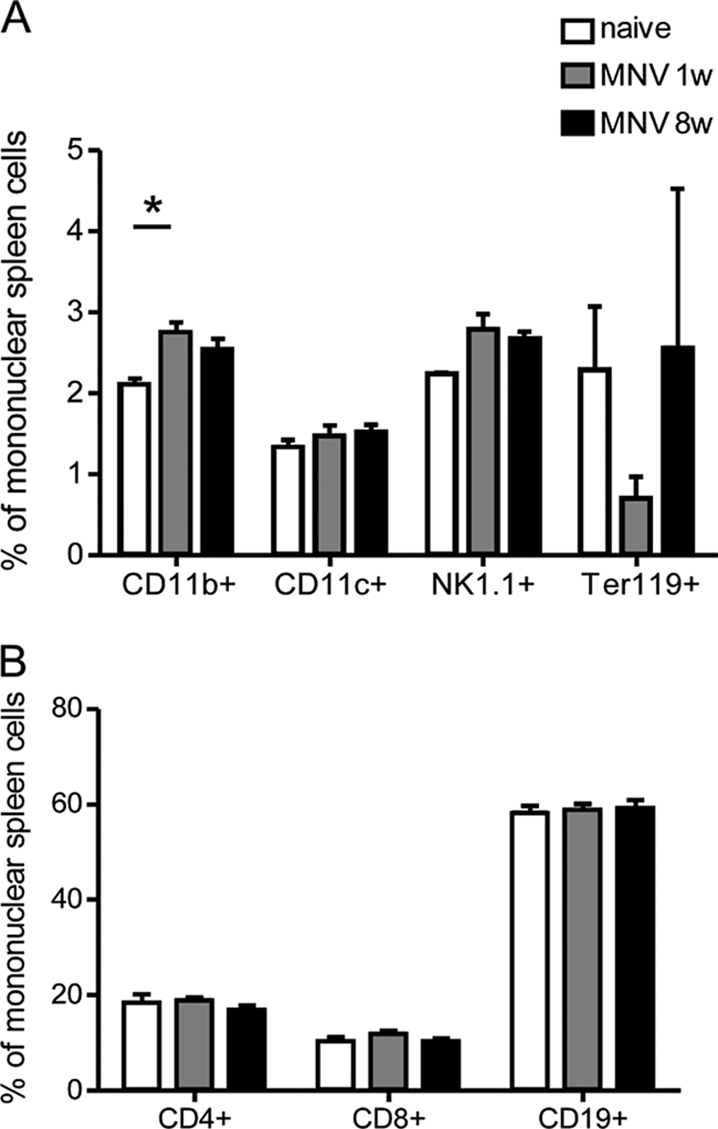
Effect of MNV infection on splenic subset proportions. Mononuclear splenocytes from mice infected with MNV at 1 and 8 wpi were stained for (A) CD11b (macrophages), CD11c (dendritic cells), NK1.1 (NK cells), and Ter119 (erythroid progenitor cells) and for (B) CD4, CD8 (T cells), and CD19 (B cells). Bars indicate means and standard errors of the means. Significant difference from naïve controls (P < 0.05 by one-way analysis of variance with Dunnett's posttest) is indicated by an asterisk. For MNV-infected mice, data are from one experiment with six infected mice and three naïve mice (n = 3).
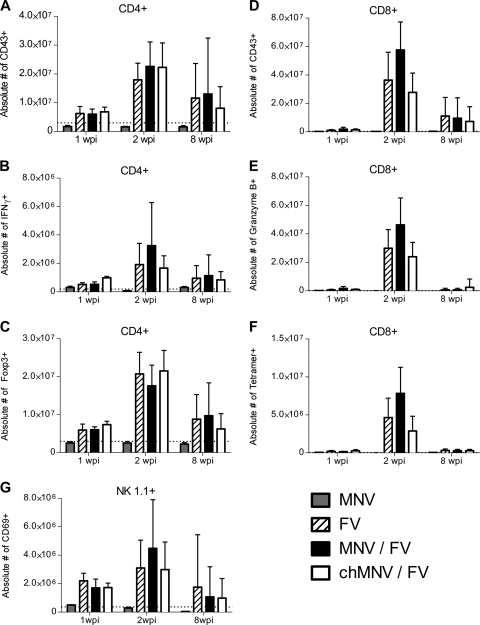
Cellular activation and function during FV-MNV coinfection. Splenocyte subsets were stained as indicated for activation markers (A, D, and G), IFN-γ (B), granzyme B (E), tetramer reactivity (F), and the regulatory T-cell marker Foxp3 (C). Data were obtained from a B.D. LSR II flow cytometry instrument and analyzed with Flowjo software. Time points are weeks postinfection with MNV alone (MNV, n = 6) or FV alone (FV, n = 8), concurrent MNV and FV infection (MNV/FV, n = 7), and FV infection in mice chronically infected with MNV 4 weeks previously (chMNV/FV, n = 8). The data from two separate experiments were pooled. Error bars indicate means and standard deviations. At no time point were there any statistically significant differences between any of the FV-infected groups (as determined by either one-way analysis of variance with Tukey's multiple-comparison posttest or Dunnett's posttest with FV set as the control.) The dotted line represents the mean value for naïve mice. Mean values for naïve mice and MNV-infected mice in the CD8+ T-cell groups are barely above the x axis.
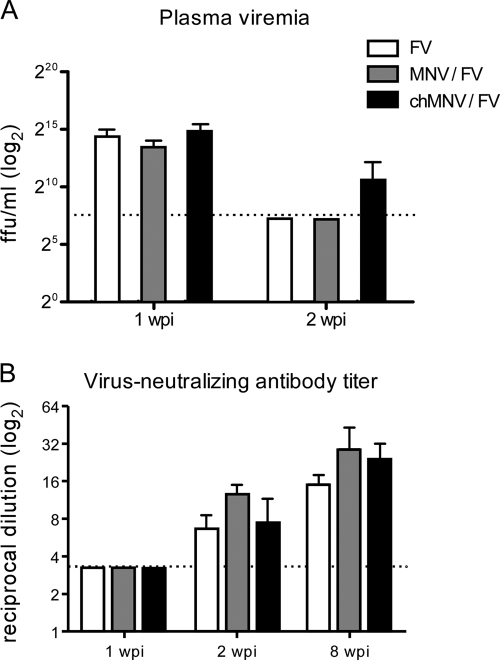
Viremia and virus-neutralizing antibody titers. (A) Mean plasma viremia titers (± the standard deviations; n = 4 per group for each time point) and (B) virus-neutralizing antibody titers were determined as previously described (21). The plasma dilution neutralizing 75% of Friend murine leukemia virus infectivity is shown. For FV infection, n = 8 for 1 and 2 wpi and 4 for 8 wpi; for MNV-FV coinfection, n = 5 to 8 per time point; for chronic MNV-FV coinfection, n = 8 per time point. The dotted lines represent the detection limit of the assays. The data were pooled from two separate experiments. At none of the time points tested did either acute or chronic MNV cause statistically significant differences between any of the test groups, as determined by one-way analysis of variance with Tukey's multiple-comparison posttest.
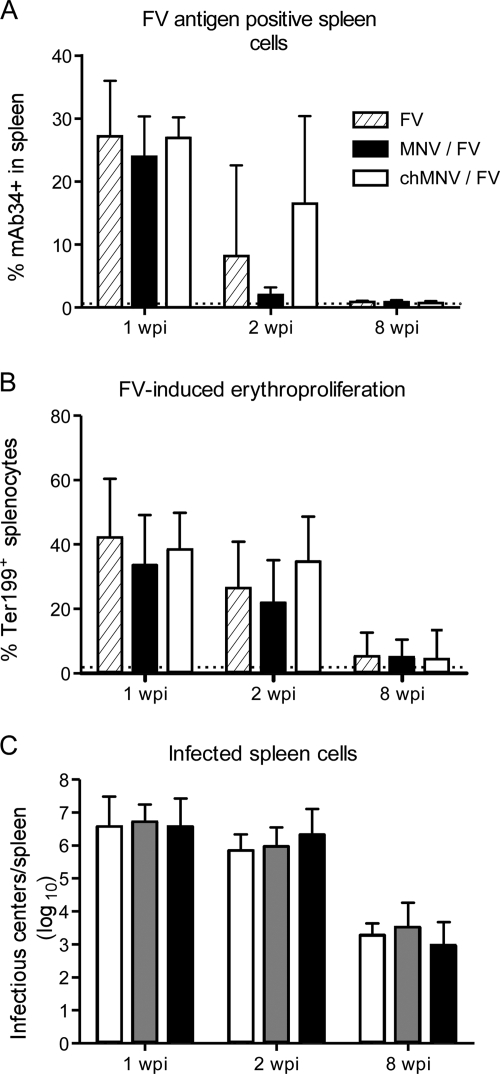
Cell-associated FV titers and pathology. Bars indicate means and standard deviations. (A) Spleen cells were stained with monoclonal antibody (MAb) 34 to detect cell surface expression of the FV-encoded glycosylated gag antigen as described previously (25). The differences between the groups were not statistically significant. (B) Proliferation of erythroid progenitor cells was determined by staining for Ter119 (25). The dotted line represents mean levels in naïve control animals. (C) Infectious centers were determined as described previously (4). In panels A to C, the numbers of mice per group were as follows: for FV infection, n = 8 per time point; for MNV-FV coinfection, n = 7 to 13 per time point; for chronic MNV-FV coinfection, n = 7 to 8 per time point. The data shown were pooled from two separate experiments.
References
-
- Chesebro, B., M. Miyazawa, and W. J. Britt. 1990. Host genetic control of spontaneous and induced immunity to Friend murine retrovirus infection. Annu. Rev. Immunol. 8:477-499. - PubMed
-
- Chesebro, B., K. Wehrly, K. Watson, and K. Chesebro. 1978. Murine leukemia virus infectious centers are dependent on the rate of virus production by infected cells. Virology 84:222-226. - PubMed
Publication types
MeSH terms
Substances
Grants and funding
LinkOut - more resources
Full Text Sources
Medical
