. 2009 Dec;20(23):4899-909.
doi: 10.1091/mbc.e09-05-0380. Epub 2009 Oct 7.

Brd4 marks select genes on mitotic chromatin and directs postmitotic transcription

Affiliations

Brd4 marks select genes on mitotic chromatin and directs postmitotic transcription

Anup Dey et al. Mol Biol Cell. 2009 Dec.

Abstract

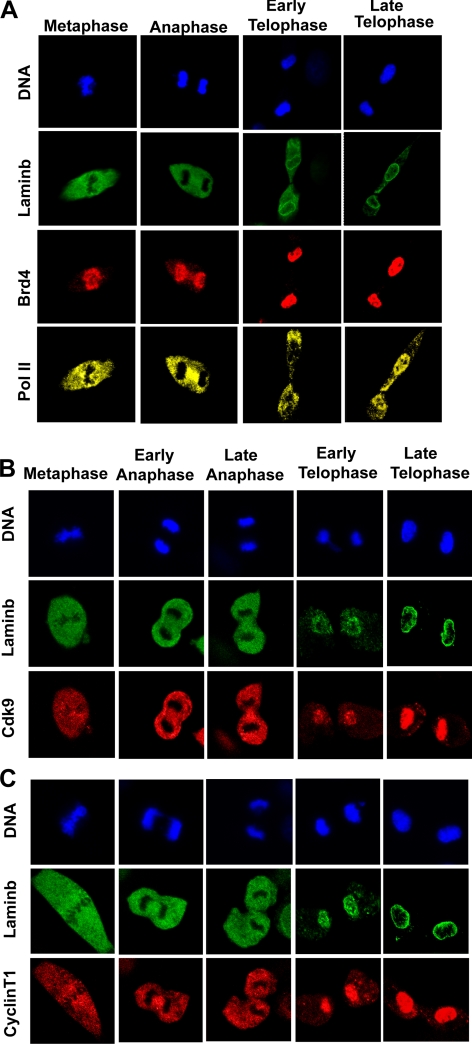
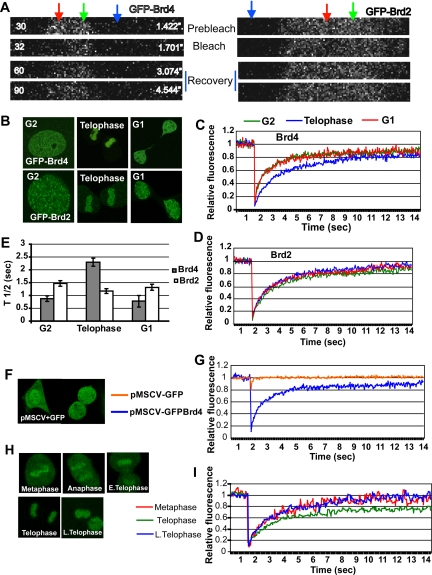
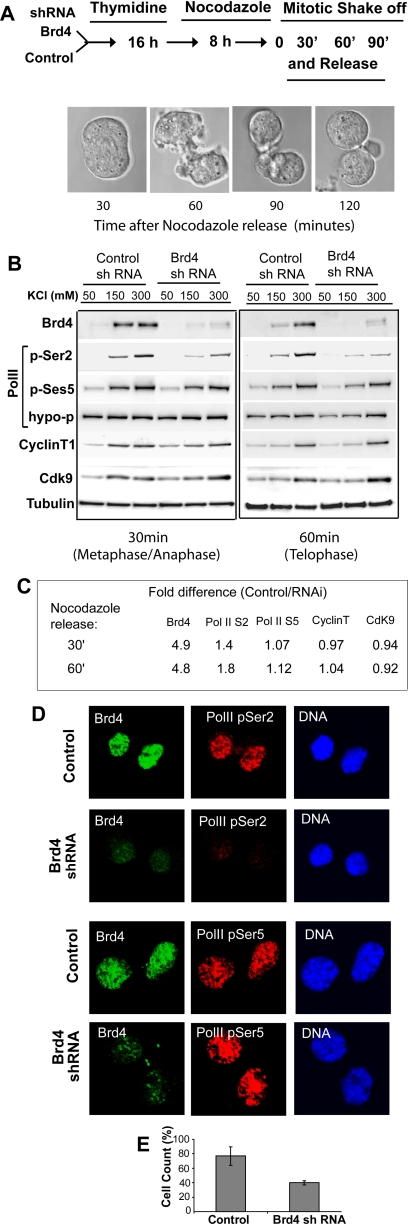
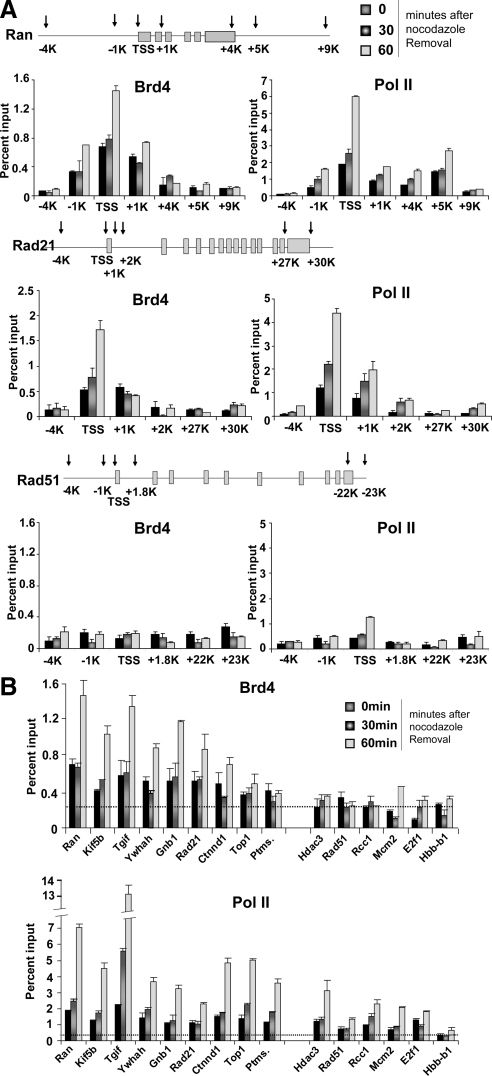
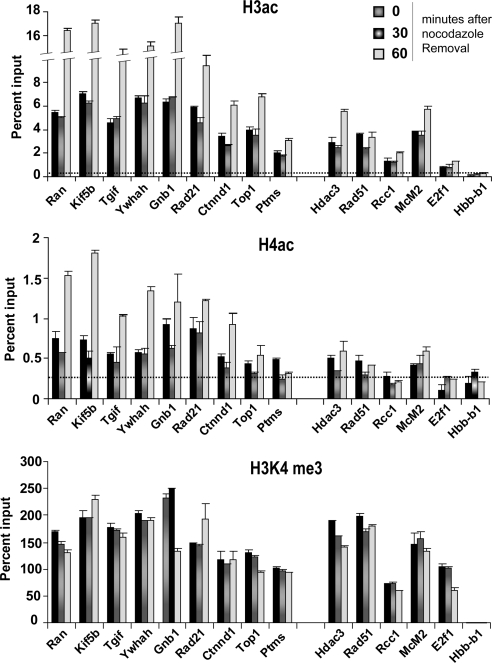
On entry into mitosis, many transcription factors dissociate from chromatin, resulting in global transcriptional shutdown. During mitosis, some genes are marked to ensure the inheritance of their expression in the next generation of cells. The nature of mitotic gene marking, however, has been obscure. Brd4 is a double bromodomain protein that localizes to chromosomes during mitosis and is implicated in holding mitotic memory. In interphase, Brd4 interacts with P-TEFb and functions as a global transcriptional coactivator. We found that throughout mitosis, Brd4 remained bound to the transcription start sites of many M/G1 genes that are programmed to be expressed at the end of, or immediately after mitosis. In contrast, Brd4 did not bind to genes that are expressed at later phases of cell cycle. Brd4 binding to M/G1 genes increased at telophase, the end phase of mitosis, coinciding with increased acetylation of histone H3 and H4 in these genes. Increased Brd4 binding was accompanied by the recruitment of P-TEFb and de novo M/G1 gene transcription, the events impaired in Brd4 knockdown cells. In sum, Brd4 marks M/G1 genes for transcriptional memory during mitosis, and upon exiting mitosis, this mark acts as a signal for initiating their prompt transcription in daughter cells.


Figures

Figure 1.
Figure 1.
Retention of Brd4 on mitotic chromosomes: reloading of Pol II and P-TEFb on chromosomes after telophase. Synchronized NIH3T3 cells were allowed to proceed through the indicated mitotic stages, fixed with paraformaldehyde, permeabilized, and immunostained for (A) Brd4 and Pol II, (B) Cdk9, and (C) Cyclin T1. Cells were coimmunostained for lamin B and counterstained for DNA with Hoechst 33342.
Figure 2.
Figure 2.
Real-time mobility of GFP-Brd4 during mitosis. (A) Live cell images of telophase chromatin in NIH3T3 cells expressing GFP-Brd4 (left) or GFP Brd2 (right) at prebleach (image 30), bleach (image 32), and recovery (image 60 and 90) from typical FRAP experiments. The red, green, and blue arrows indicate the photobleached area, the area without photobleach, or the area taken as background, respectively (25 pixels each). (B) Fluorescent images were acquired from live cells expressing GFP-Brd4 or GFP-Brd2 at indicated stages of cell cycle. (C) Cells expressing GFP-Brd4 were photobleached at the indicated stages of the cell cycle and analyzed for recovery. Fluorescence recovery was quantified at indicated times (sec) from 15 separate cells. (D) FRAP analysis was performed with cells expressing GFP-Brd2 at the indicated stages of the cell cycle. Recovery was quantified from the measurement of 15 independent cells. (E) The averages of half recovery times (t1/2) recorded in C and D are plotted. (F) Fluorescent images of cells expressing free GFP (pMSCV-GFP). (G) Fluorescence recovery of free-GFP was quantitatively compared with that of GFP-Brd4 from analyses of 10 independent cells each. (H) Images of cells at different stages of mitosis with GFP-Brd4. (I) Recovery was quantified from the analyses six independent cells at indicated stages of mitosis.
Figure 3.
Figure 3.
Reduction of postmitotic S2-phosphorylation of Pol II CTD in Brd4 knockdown cells. (A) A diagram of the synchronization procedure. Cells with control shRNA or Brd4 shRNA were synchronized by thymidine and nocodazole, released, and allowed to proceed for the indicated times. Mitotic progression was viewed by DIC images. (B) Extracts from control (control shRNA) and Brd4 knockdown cells (Brd4 shRNA) at 30 and 60 min after release were extracted with buffers with increasing KCl concentrations. Extracts were immunoblotted with the indicated antibodies. Pol II phosphorylated at S2, or at S5 in the CTD, and hypophosphorylated Pol II were detected by H5, H14, and 8WG16 antibodies, respectively. (C) Quantification of immunoblot data. Band intensity of each protein was normalized by respective tubulin bands. Values represent the ratio of band intensity in control cells/Brd4 knockdown cells collected from all salt concentrations. Note that ratios are higher only for Brd4 and S2-phosphorylated Pol II. Similar results were seen with separate preparations of extracts. (D) Control and Brd4 knockdown cells at 90 min were coimmunostained for Brd4 (green) and Pol II with phospho-S2 CTD (top panels, red) or with phospho-S5 (bottom panels) and counterstained for DNA. (E) The percentage of phospho-S2 positive cells in control and Brd4 knockdown cells was obtained by counting 200–250 cells in three independent fields.
Figure 4.
Figure 4.
Reduction of postmitotic de novo transcription in Brd4 knockdown cells. (A) Cells synchronized as in Figure 3A were allowed to reach telophase, pulsed with BrU for 15 min and immunostained for Brd4 (green) and BrU (red), counterstained for DNA. (B) Control and Brd4 knockdown cells synchronized as above were pulsed with [3H]uridine for 15 min and amounts of incorporated 3H were quantified. The values represent the average of three assays ± SD. (C) Control and Brd4 knockdown cells synchronized as above were tested for de novo transcription of indicated genes by qRT-PCR. Transcript levels were normalized by 18S RNA. Values represent the average of three determinations ± SD. Results of additional genes are shown in Supplementary Figure S2. The primer information is in Supplementary Table S1.
Figure 5.
Figure 5.
Brd4 marks the TSS regions of M/G1 genes throughout mitosis. (A) ChIP analysis was performed with affinity-purified anti-Brd4 antibody (left) or antibody against hypophosphorylated Pol II (8WG16, right) at indicated sites in the Ran, Rad21, and Rad51 genes for cells at indicated times after release. Values in A and B (and all ChIP data below) represent the average of three determinations ± SD. (B) ChIP analysis was performed with the antibodies against Brd4 or hypophosphorylated Pol II as in A for the TSS regions of indicated M/G1 genes. Dotted lines represent averaged values for normal IgG binding (SD, <0.01%).
Figure 6.
Figure 6.
Histone acetylation marks correlate with Brd4 gene marking on mitotic cells. ChIP analysis was performed with antibody against di-acetyl H3 (K9, 14), tetra-acetyl H4 (K5, 8, 12, and 16), and H3K4me3 on the TSS of M/G1 genes. Dotted lines represent averaged values for normal IgG binding (SD, <0.01).
Figure 7.
Figure 7.
Brd4-dependent recruitment of P-TEFb and S2 phosphorylation of Pol II CTD at telophase. Binding of Brd4, Cdk9 (P-TEFb), and three forms of Pol II to the TSS of indicated M/G1 genes was tested for control and Brd4 knockdown cells at the indicated times after release.

References

    1. Bisgrove D. A., Mahmoudi T., Henklein P., Verdin E. Conserved P-TEFb-interacting domain of BRD4 inhibits HIV transcription. Proc. Natl. Acad. Sci. USA. 2007;104:13690–13695. - PMC - PubMed
    1. Burke L. J., et al. CTCF binding and higher order chromatin structure of the H19 locus are maintained in mitotic chromatin. EMBO J. 2005;24:3291–3300. - PMC - PubMed
    1. Christova R., Oelgeschlager T. Association of human TFIID-promoter complexes with silenced mitotic chromatin in vivo. Nat. Cell Biol. 2002;4:79–82. - PubMed
    1. Chuang J. Y., Wang Y. T., Yeh S. H., Liu Y. W., Chang W. C., Hung J. J. Phosphorylation by c-Jun NH2-terminal kinase 1 regulates the stability of transcription factor Sp1 during mitosis. Mol. Biol. Cell. 2008;19:1139–1151. - PMC - PubMed
    1. Core L. J., Waterfall J. J., Lis J. T. Nascent RNA sequencing reveals widespread pausing and divergent initiation at human promoters. Science. 2008;322:1845–1848. - PMC - PubMed

MeSH terms

LinkOut - more resources