. 2009 Oct 7;29(40):12374-83.
doi: 10.1523/JNEUROSCI.2908-09.2009.

Neural dynamics of saccadic suppression

Affiliations

Neural dynamics of saccadic suppression

Frank Bremmer et al. J Neurosci. .

Abstract

We make fast, ballistic eye movements called saccades more often than our heart beats. Although every saccade causes a large movement of the image of the environment on our retina, we never perceive this motion. This aspect of perceptual stability is often referred to as saccadic suppression: a reduction of visual sensitivity around the time of saccades. Here, we investigated the neural basis of this perceptual phenomenon with extracellular recordings from awake, behaving monkeys in the middle temporal, medial superior temporal, ventral intraparietal, and lateral intraparietal areas. We found that, in each of these areas, the neural response to a visual stimulus changes around an eye movement. The perisaccadic response changes are qualitatively different in each of these areas, suggesting that they do not arise from a change in a common input area. Importantly, our data show that the suppression in the dorsal stream starts well before the eye movement. This clearly shows that the suppression is not just a consequence of the changes in visual input during the eye movement but rather must involve a process that actively modulates neural activity just before a saccade.


Figures

Figure 1.
Figure 1.
Experimental paradigm. Left column, Time course. The animal achieved fixation of the fixation target and kept fixating until the target was switched off and the saccade target appeared. A brief visual stimulus appeared around the time of the saccade in peri trials (as schematized here) or during fixation long before or after the saccade in pre and post trials. Right column, Spatial layout. The fixation point (red dot) was 10° to the left of the vertical midline, and the saccade target (green dot) was 10° to the right. Visual stimuli were large (10 × 60°) bright bars on a dark background. Hor., Horizontal; Vert., vertical.
Figure 2.
Figure 2.
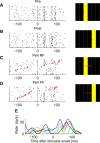
Saccadic suppression in an MT neuron. A–D, Response of a single neuron to a stimulus flashed at time 0; each black vertical tick corresponds to a single spike. The diagrams on the right show the screen (black rectangle), the position of the stimulus (yellow bar) on the screen, and the position of the eye (red dot for fixation, red arrow for saccades). A, Response to stimuli flashed long before a saccade. The stimulus is flashed in the receptive field. B, Response to stimuli flashed long after the 20° rightward saccade. These flashes appear in the future field, i.e., the position of the receptive field after the saccade. C, Response to stimuli flashed in the receptive field (RF), in the perisaccadic time window. The time of the saccade is indicated by the red triangles. For this representation, trials were sorted such that the time from stimulus flash to saccade onset was largest for the topmost trial and most negative (i.e., the flash came after the saccade had started) for the bottom-most trial. D, Response to stimuli flashed in the perisaccadic window in the future field (FF). E, Spike density calculated from A–D. The red (blue) curve represents the average response to pre (post)-saccadic stimuli. Green (black) curves represent the response to perisaccadic stimuli flashed in the receptive field as shown in C (future field; D). Solid curves are average responses for flashes presented before the eye started to move [the difference between flash time and saccade onset was in the interval (−75 ms, 0 ms)]. Dashed curves represent the average for flashes presented once the eye has started to move (0 ms, 75 ms). This neuron responded less to perisaccadic than to presaccadic or postsaccadic stimuli; the mechanisms involved in this are a mixture of active and passive processes (for details, see Results).
Figure 3.
Figure 3.
Comparison of visual responsiveness. In all four areas (A: MT; B, MST; C, VIP; D, LIP), the median visual response during fixation long before a saccade was normalized to a value of 100%. The response was computed for a preselected response window (60–120 ms after stimulus onset). The horizontal lines and asterisks indicate significant differences (p < 0.05) as calculated by a repeated-measures ANOVA on ranks, followed by Tukey–Kramer-corrected post hoc tests (for details, see Results).
Figure 4.
Figure 4.
Time course of the stimulus response. Population average responses to bars flashed long before (red), during (green), or long after (blue) a saccade. These curves are aligned to the presentation of the flash, but for each cell, we corrected for its response latency. Accordingly, in each panel, a time value of zero indicates response onset. The black curve shows the average response of the same population to saccades made in darkness. For this curve, time 0 is saccade onset but is again corrected for the response latencies of individual cells to allow direct comparison with the visual responses of the other three curves. Circles show the data points calculated in independent time windows, curves show spline interpolation of those data points, and the shading around the curves indicates the 95% confidence intervals of the estimates of the mean population response. A, MT population. B, MST population. C, VIP population. D, LIP population. In LIP the visual stimulus reduced the response compared with the saccade-only condition. In MT, MST, and VIP, the average perisaccadic response was reduced compared with the presaccadic and postsaccadic responses. sp/s, Spikes per second.
Figure 5.
Figure 5.
Comparison of neural and behavioral data. For the behavioral data, the horizontal axis shows time relative to saccade onset, and the right vertical axis indicates normalized contrast sensitivity as taken from the study by Diamond et al. (2000). Neuronal data were shifted along the time axis to correct for response and processing latencies (see Results) and represent neuronal excitability (left vertical axis) of the MT and MST populations (cyan and blue curves, respectively) and the VIP population (red curve). The time course of neuronal excitability in all three motion areas of the macaque shows a good qualitative match with the time course of perceptual loss of sensitivity around saccades in human subjects.
Figure 6.
Figure 6.
Comparison of perisaccadic and presaccadic peak responses. We compared the maximum response that could be evoked by a stimulus (at any position on the screen) long before a saccade (−1000, −400 ms) with the maximum response to stimuli presented just before (−75, 0 ms) or during (0, 75 ms) a saccade. For both perisaccadic intervals, we computed for each cell a suppression index (for definition, see Results). A–D show the distribution of the suppression indices for the two temporal intervals. A, The population of MT neurons. B, The population of MST neurons. C, The population of VIP neurons. D, The population of LIP neurons. The population medians are indicated by the blue (just before) and red (during) arrows in each panel. In all four populations, the median suppression index was significantly below zero (p < 0.001) for stimuli presented just before and during saccades. In all but the LIP population, the median peak responses for stimuli shown briefly before and during the saccade were not significantly different (p > 0.6). Saccadic suppression in the dorsal stream therefore starts for stimuli presented before the eyes start to move and does not significantly change during the eye movement.
Figure 7.
Figure 7.
Perisaccadic activity maps. The horizontal axis represents the time from stimulus onset relative to saccade onset, and the vertical axis represents the time relative to response onset (i.e., this is relative to stimulus onset but after the response of each cell has been corrected for its latency; see Materials and Methods). The color represents the firing rate of the neuron at some time relative to response onset (vertical axis), for a stimulus that was presented at a given time relative to saccade onset (horizontal axis). Positive values along the horizontal axis indicate that a stimulus was presented after saccade onset. The diagonal black line shows the time at which the saccade started. A, MT population response. B, MST population response. C, VIP population response. D, LIP population response. For response details, see Results. sp/s, Spikes per second.
Figure 8.
Figure 8.
Suppression map. The horizontal axis represents the time from stimulus onset relative to saccade onset, and the vertical axis represents the time relative to response onset. The color represents a statistical estimate of the suppression/enhancement measured relative to stimuli presented long before a saccade (see Materials and Methods). The diagonal white line shows the time at which the saccade started. A, Suppression and enhancement in the MT population. B, Suppression and enhancement in the MST population. C, Suppression and enhancement in the VIP population. D, Suppression and enhancement in the LIP population.

References

    1. Bisley JW, Goldberg ME. Neuronal activity in the lateral intraparietal area and spatial attention. Science. 2003;299:81–86. - PubMed
    1. Born RT, Bradley DC. Structure and function of visual area MT. Annu Rev Neurosci. 2005;28:157–189. - PubMed
    1. Bremmer F, Ilg UJ, Thiele A, Distler C, Hoffmann KP. Eye position effects in monkey cortex. I. Visual and pursuit-related activity in extrastriate areas MT and MST. J Neurophysiol. 1997a;77:944–961. - PubMed
    1. Bremmer F, Distler C, Hoffmann KP. Eye position effects in monkey cortex. II. Pursuit- and fixation-related activity in posterior parietal areas LIP and 7A. J Neurophysiol. 1997b;77:962–977. - PubMed
    1. Bremmer F, Kubischik M, Hoffmann KP, Krekelberg B. Neural dynamics of saccadic suppression. Soc Neurosci Abstr. 2002;28:57–2. - PMC - PubMed

Publication types

LinkOut - more resources