. 2009 Oct 7;29(40):12574-83.
doi: 10.1523/JNEUROSCI.2614-09.2009.

Neural correlates of value, risk, and risk aversion contributing to decision making under risk

Affiliations

Neural correlates of value, risk, and risk aversion contributing to decision making under risk

George I Christopoulos et al. J Neurosci. .

Abstract

Decision making under risk is central to human behavior. Economic decision theory suggests that value, risk, and risk aversion influence choice behavior. Although previous studies identified neural correlates of decision parameters, the contribution of these correlates to actual choices is unknown. In two different experiments, participants chose between risky and safe options. We identified discrete blood oxygen level-dependent (BOLD) correlates of value and risk in the ventral striatum and anterior cingulate, respectively. Notably, increasing inferior frontal gyrus activity to low risk and safe options correlated with higher risk aversion. Importantly, the combination of these BOLD responses effectively decoded the behavioral choice. Striatal value and cingulate risk responses increased the probability of a risky choice, whereas inferior frontal gyrus responses showed the inverse relationship. These findings suggest that the BOLD correlates of decision factors are appropriate for an ideal observer to detect behavioral choices. More generally, these biological data contribute to the validity of the theoretical decision parameters for actual decisions under risk.


Figures

Figure 1.
Figure 1.
Task and behavioral results. A, Psychophysical definition of certainty equivalent. The CE of a gamble is the amount for which an agent is indifferent between receiving it for sure and opting for the gamble. This definition implies that the probability of choosing the CE instead of the gamble is p = 0.5. Examples show probability distributions of safe choices as a function of safe amounts for two participants with different degrees of risk aversion (thick line for stronger risk aversion with lower CE). B, Iterative determination of CE. In each trial, participants chose between a safe and a risky option. The staircase method (PEST procedure) iteratively adjusted the safe option in consecutive trials to approximate choice indifference between the two options. Lines show data from two participants with different CEs (thicker line represents higher risk aversion). The shape of each dot illustrates safe and risky choices. Vertical lines indicate good approximation of indifference values and mark onset of scanning. C, Choice options as presented to participants (first experiment). Participants chose between either a safe option or one of two gambles with two equiprobable outcomes (40/60 and 10/90, respectively). Each screen shows a safe (left) and a risky option, the safe value being set to choice indifference. The first row represents the choice set a less risk-averse participant faced, whereas the second row the choice set of a very risk-averse participant. The first column represents the low risk condition (choices involving the low risk gamble), whereas the second column represents the high risk condition (choices involving the high risk gamble). D, Differential assessment of key decision parameters: EV, risk (as increase in spread), and utility. Each comparison serves to identify differences in two of these parameters. Comparison A tests differences in risk and utility but not EV; comparison B tests EV and utility, controlling for risk. E, CE of participants. CEs of individual participants for the two gambles (40/60 and 10/90) are displayed according to increasing risk aversion. Lower CEs, and larger differences between CEs for the two gambles, indicate increasing risk aversion. F, Choice options as presented to participants (second experiment). Participants again chose between a safe and an even-chance gamble. This time, four gambles were used: the first two (offering £10 or £50 and £15 or £45, respectively) had expected value of £30, whereas the other two (offering £40 or £80 and £30 or £90, respectively) had an expected value of £60. For gambles with the same expected value, one was riskier than the other. Importantly, safe alternatives were not set to indifference level but took semi-random values.
Figure 2.
Figure 2.
Brain activity related to value and risk. All BOLD responses presented were modeled on presentation of the stimuli (options) and are estimated by the related regression slope parameter estimates (β). A, Value coding by VSt. Response location in VSt sensitive to magnitude/EV differences (p < 0.05, small volume correction, displayed at p = 0.01). Red, First experiment, comparing safe alternatives, choice situation; yellow, first experiment, same in no-choice situation; green, second experiment, comparing safe choices having different magnitude; blue, second experiment, comparing risky choices having different EV. Darkest voxels reflect common activation areas. B, Quantitative value coding by ventral striatum. B1, Increasing difference in the magnitude of the safe alternatives of each gamble (x-axis) correlates with the differential VSt response to the choice of these alternatives (y-axis) (solid line; R2 = 0.68; p = 0.0005). This signal does not change when we compare high risk (HR) and low risk (LR) gambles (comparison A in Fig. 1, signaling either risk or utility) (dotted line). B2, The same area shows a similar activation pattern in no-choice trials. B3, B4, In addition, a neighboring voxel (peak at −22/6/8) distinguishes between high and low expected value in the second experiment. B4 is essentially the same as B1, with the exception that we now compare the two risky options with different expected values, whereas in the first experiment, we compared safe options with different magnitudes. C, Risk coding by dACC. Comparing activity emerging from a choice of the high risk option to activity related to a choice of the low risk one, risk-sensitive areas were identified. This comparison reached significance in dACC (p < 0.05, displayed at p = 0.01). This signal also does not covary with risk attitudes or the utility of each option. Red, First experiment, comparing high and low risk gambles, choice condition; yellow, second experiment, comparing high and low risk gambles. D, Quantitative coding of risk by dACC. dACC shows higher response for the high risk gamble than to the low risk option. D1, An interaction effects analysis suggested that this sensitivity of dACC to the high risk occurs only in choice trials and not in no-choice trials (p < 0.05). Error bars represent SEM. D2, The same area showed increasing response to high risk compared with low risk in the second experiment, in which the safe alternatives are not set to indifference level. This suggests that the dACC response to higher risk is not attributable to the lower value of the alternative offer (which is the case in the first experiment).
Figure 3.
Figure 3.
Modulation of IFG activity by risk aversion. A, Increased differential IFG activity with risk aversion. y-axis represents the difference of the IFG parameter estimate of the BOLD response preceding a choice of the low risk gamble minus the corresponding IFG parameter preceding a choice of the high risk gamble. x-axis represents risk aversion of each participant, as measured by the monetary difference between the CE of the two gambles (CElow risk gamble − CEhigh risk gamble). The more risk averse the participant, the larger the difference in BOLD response in IFG (p < 0.05, whole-brain correction). The first image is from the first experiment. The next three images depict sagittal, axial, and coronal planes showing the common right DLPFC activated voxels for the risk-attitude-related contrast. Red, First experiment, choice condition; yellow, first experiment, no-choice condition; green, second experiment. B, Correlation of BOLD response in IFG to safe and low risk gambles with individual risk aversion. The IFG response slope increases with gambles of decreasing risk, thus providing better discrimination of lower risks in risk-averse participants. This selective coding of a “safety signal” for more risk-averse participants is verified by the similar (increasing) activity of the same voxel as a response to safe choices. In contrast, activity related to a choice of the high risk option does not correlate with individual risk aversion. The R2 values for each regression line are as follows: low risk gamble, 0.49; low risk safe, 0.46; high risk safe, 0.34; high risk gamble, 0.00.
Figure 4.
Figure 4.
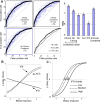
Detection of risky choices by combined brain signals of decision parameters. A, Evaluation of detection. By applying binary logistic regression, we tested whether a model combining signals of VSt, dACC, and IFG (corresponding to EV, risk, and risk aversion) could detect the choice on a trial-by-trial basis. ROC values depicted here indicate the model-based probability of correctly detecting a risky choice. The ROC values for the combined model (using activity from all structures) are 0.77 (first experiment; top left) and 0.74 (second experiment; top right). Both are significantly different from chance performance (ROC = 0.5; straight diagonal lines; see also the right) and models using the BOLD response from one structure only (bottom right). B, Contribution of brain structures to probability of risky choice. x-axis represents level of BOLD responses (of VSt, dACC, or IFG), whereas y-axis represents the probability of a risky choice, as computed by the regression equations. Increasing activity of VSt and dACC increases the probability of a risky choice. On the contrary, increasing activity of IFG increases the probability of a safe choice. C, Effect of IFG activity. x-axis represents the activity of both VSt and dACC. Dotted line (left) depicts the probability of a risky choice (as computed by the regression equation), with respect to VSt and dACC activity, when IFG activity is low. When the activity of IFG is high (solid line), then higher compensatory activity of VSt and dACC is required to elicit the same probability of a risky choice.

References

    1. Abler B, Walter H, Erk S, Kammerer H, Spitzer M. Prediction error as a linear function of reward probability is coded in human nucleus accumbens. Neuroimage. 2006;31:790–795. - PubMed
    1. Barch DM, Braver TS, Akbudak E, Conturo T, Ollinger J, Snyder A. Anterior cingulate cortex and response conflict: effects of response modality and processing domain. Cereb Cortex. 2001;11:837–848. - PubMed
    1. Behrens TE, Woolrich MW, Walton ME, Rushworth MF. Learning the value of information in an uncertain world. Nat Neurosci. 2007;10:1214–1221. - PubMed
    1. Binswanger HP. Attitudes toward risk: experimental measurement in rural India. Am J Agric Econ. 1980;62:395–407.
    1. Breiter HC, Aharon I, Kahneman D, Dale A, Shizgal P. Functional imaging of neural responses to expectancy and experience of monetary gains and losses. Neuron. 2001;30:619–639. - PubMed

Publication types

LinkOut - more resources