. 2009 Oct 7;29(40):12641-52.
doi: 10.1523/JNEUROSCI.1124-09.2009.

Properties of piriform cortex pyramidal cell dendrites: implications for olfactory circuit design

Affiliations

Properties of piriform cortex pyramidal cell dendrites: implications for olfactory circuit design

Brice Bathellier et al. J Neurosci. .

Abstract

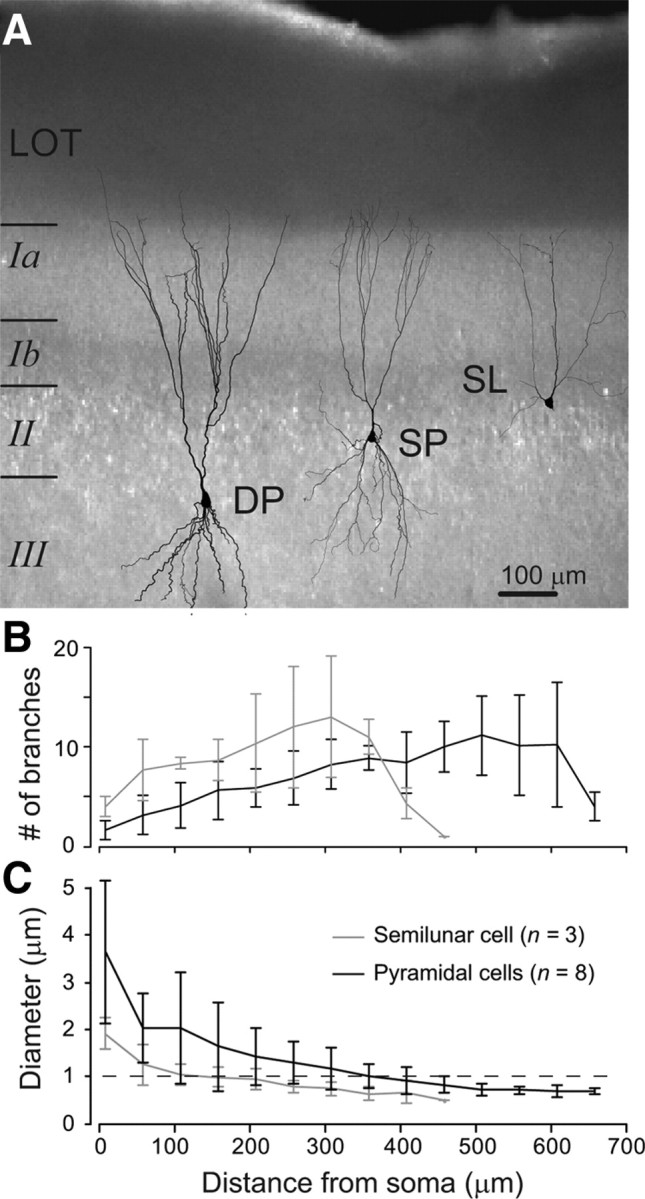
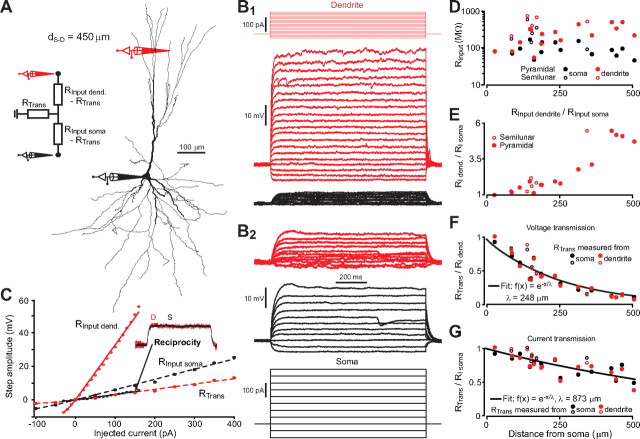
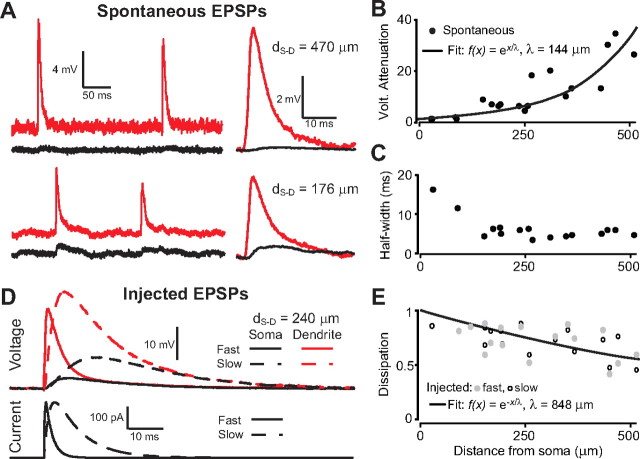
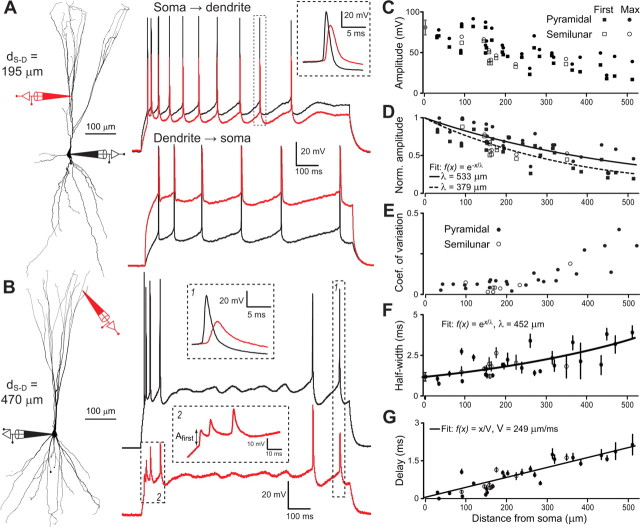
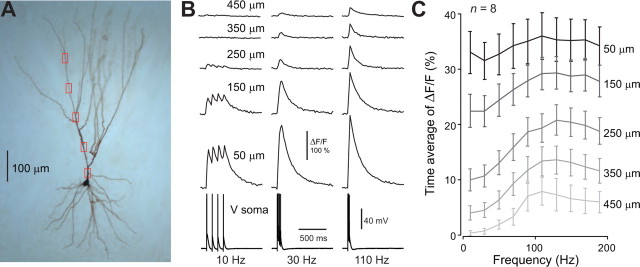
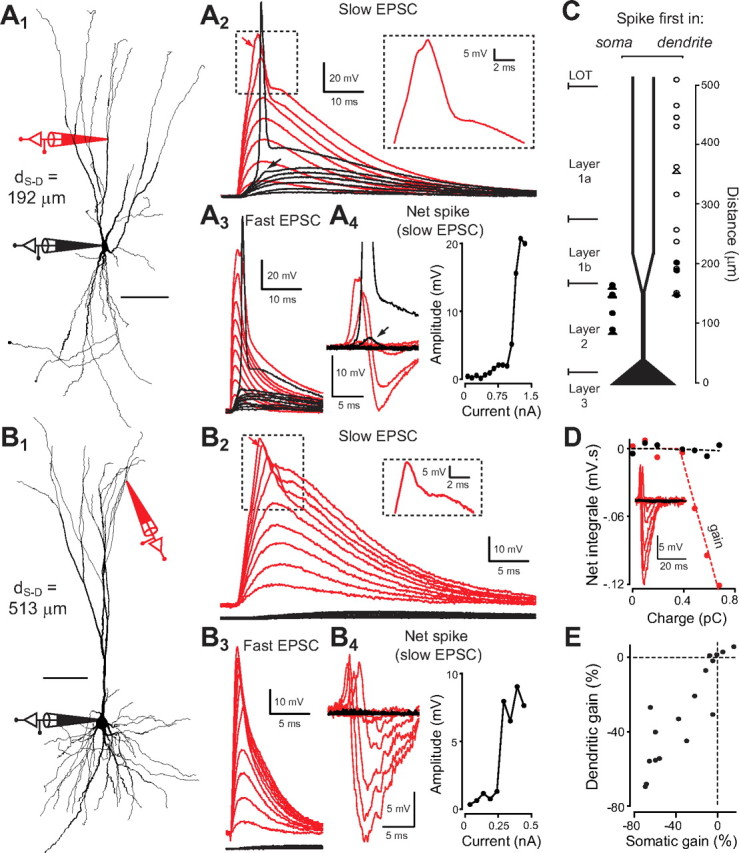
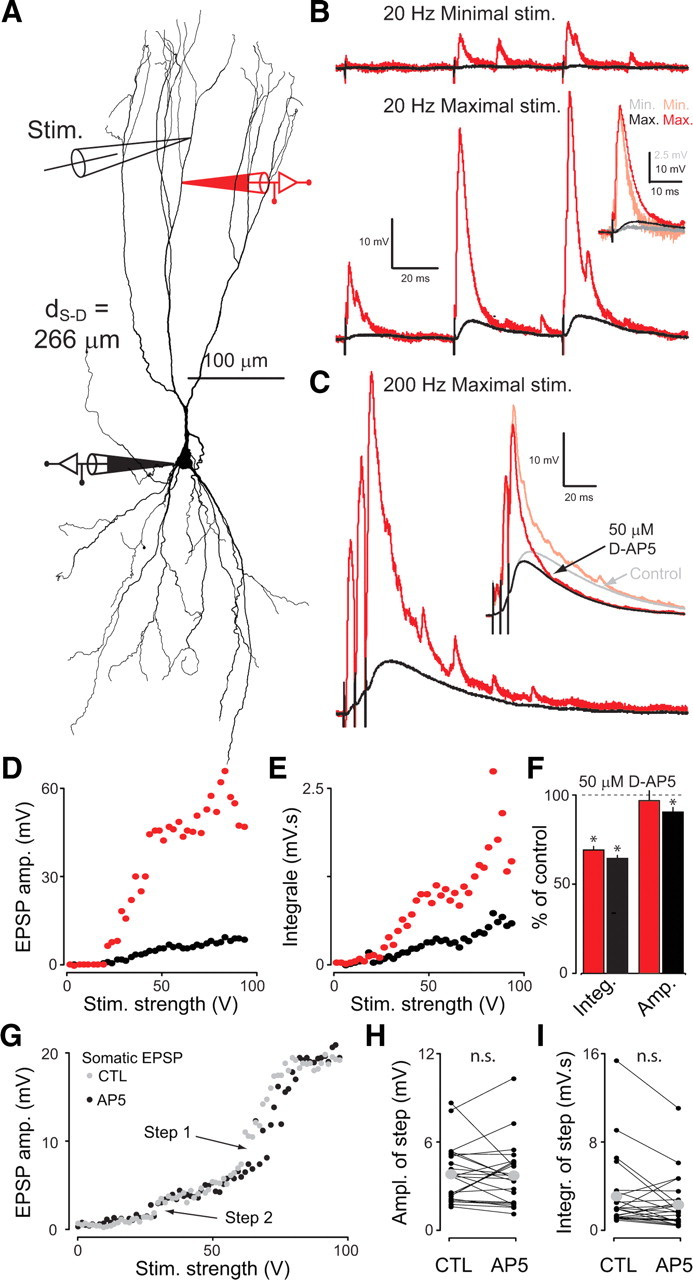
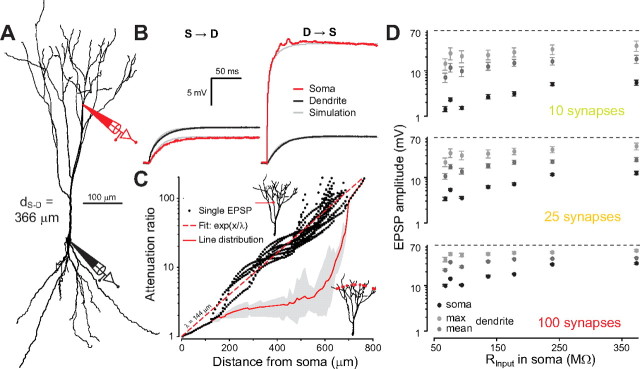
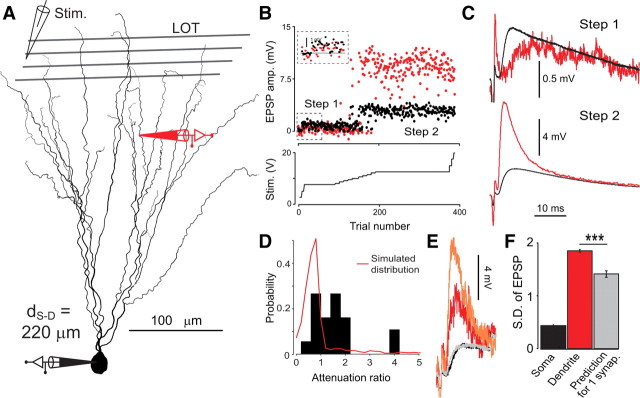
Unlike the neocortex, sensory input to the piriform cortex is anatomically segregated in layer 1, making it ideal for studying the dendritic integration of synaptic inputs pivotal for sensory information processing. Here we investigated dendritic integration of olfactory bulb inputs in pyramidal cells using dual patch-clamp recordings along the soma-apical dendritic axis. We found that these dendrites are relatively compact with 50% maximal somatic current loss for synaptic inputs arriving at distal dendritic regions. Distal dendrites could generate small and fast local spikes, but they had little impact on the soma, indicating that they are only weakly active. In contrast to the neocortex, we found no evidence for dendritic Ca(2+) or NMDA spikes though these dendrites actively supported action potential backpropagation with concomitant entry of Ca(2+) ions. Based on experiments and simulations we suggest that regardless of dendritic location, olfactory bulb inputs have nearly uniform potency and are distributed diffusely over the distal apical tree (layer Ia), thereby minimizing sublinear summation effects. This indicates that any stimulus feature extraction performed by these cells will occur at the soma and is based on the nearly linear sum of olfactory bulb inputs, rather than on explicitly designed clusters of functionally related synapses in the dendritic tree.


Figures

Figure 1.
Figure 1.
Dendritic architecture of piriform cortex excitatory neurons. A, IR-DIC image (4× magnification) of an anterior piriform cortex slice. Reconstructions of the dendrites of the three main excitatory cell types are superimposed (DP, deep pyramidal cell; SP superficial pyramidal cell; SL, semilunar cell). B, Mean number of apical dendritic sub-branches versus distance from soma (error bar = SD). C, Mean dendritic diameter versus distance from soma (error bar = SD).
Figure 2.
Figure 2.
Steady-state properties of passive electrical conduction. A, Right, Reconstruction of a piriform cortex (PC) pyramidal cell with the positions of somatic and dendritic (d S-D = 450 μm from soma) recordings. Left, Two-port T-circuit corresponding to the recording setup. B, Top, Step current injections to the dendrite and resulting voltage response at dendrite (red) and soma (black). Bottom, Same as top but for injections at the soma. C, Measured steady-state voltage (circles) in soma and dendrite as a function of injected current, the slope of linear regressions (lines) gives input or transfer resistances. The transfer resistance is the same for both directions of current injection (reciprocity) showing the linearity of electrical conduction in the dendrites. D, Absolute value of input resistances at the dendrite (red) and soma (black) for all paired recording plotted as a function of the distance between the recording sites (i.e., each point is a different recording in a different cell). Filled symbols: pyramidal cells; empty symbols: semilunar cells. E, Ratio of dendritic and somatic input resistances. F, Ratio of transfer resistance and dendritic input resistance (i.e., fraction of transmitted voltage from dendrite to soma). G, Ratio of transfer resistance and somatic input resistance (i.e., fraction of transmitted current from dendrite to soma, or equivalently, fraction of transmitted voltage from soma to dendrite).
Figure 3.
Figure 3.
Passive conduction of synaptic transients. A, Left, Examples of spontaneous EPSPs recorded simultaneously in a dendrite and at the soma of two neurons. Right, Average of all recorded spontaneous EPSPs for each neuron. B, Attenuation of spontaneous EPSP amplitude from dendrite to soma. C, Half-widths of spontaneous EPSPs in the dendrite. D, Bottom, Fast and slow current transients injected in the dendrite to mimic an EPSC. Top, Corresponding voltage response in the dendrite (red) and in the soma (black). E, Fraction of the total injected charge reaching the soma for fast and slow EPSPs.
Figure 4.
Figure 4.
Action potential backpropagation. A, Left, Reconstruction of a PC pyramidal cell with the locations of somatic and dendritic (d S-D = 195 μm from soma) recordings. Right, Spike trains elicited by step current injections recorded at the somatic and dendritic locations. The inset shows a magnification of the spike enclosed in the dashed rectangle. B, Same as A (top) for a distal dendritic (d S-D = 470 μm from soma) recording and step current at the soma. Note the variability of backpropagating spike amplitude in the dendritic recording. C, Backpropagating spike amplitude in the dendrite as function of somatic distance: circles, maximum AP amplitude in the train; squares, first spike of a train. Recordings in semilunar cells are shown with empty markers. D, Ratio of backpropagating spike amplitude to somatic spike amplitude: circles, maximum in each train; squares, first spike of a train. E, Coefficient of variation of backpropagating spike amplitude computed over all recorded spikes in a cell. F, Half-width of the backpropagating spike (average and SD). G, Peak-to-peak delay between somatic and backpropagating dendritic spikes (average and SD).
Figure 5.
Figure 5.
Calcium influx triggered by backpropagation of action potential bursts. A, Biocytin-filled layer 3 pyramidal neuron. Red rectangles indicate imaging locations. B, Calcium responses (OGB-1) to trains of four action potentials (10, 30, 110 Hz) recorded at the five dendritic locations shown in A. Electrical recordings from the soma are shown at the bottom. C, Time-averaged calcium response measured over a 1 s poststimulus window as a function of spike train frequency at five different distances (average over n = 8 neurons).
Figure 6.
Figure 6.
Generation of small local dendritic spikes. A1, Reconstruction of a PC pyramidal cell with the locations of somatic and dendritic (d S-D = 192 μm from soma) recordings shown schematically. A2, Voltage at soma and dendrite resulting from increasing EPSC-like injections in the dendrite. Large dendritic depolarizations generate a fast sodium spike (see magnification in the inset of the spike indicated by the upper arrow). The lower arrow shows the effect of the dendritic spike when it failed to trigger an AP in the axon hillock. A3, Same as A2 but for a faster EPSC. A4, Left, Traces of net spikes in the soma and dendrite (actual voltage minus voltage predicted from subthreshold EPSPs) for A 2. Right, Net spike amplitude versus injected current amplitude for A2. B, Same as A for a more distal recording (d S-D = 513 μm from soma). In this case, it was not possible to trigger a somatic AP. C, Plot showing whether a spike was initiated first in the dendrite (right) or in the soma (left) for an increasing current injection at the dendrite. Circles indicate pyramidal cells and triangles semilunar cells. Empty markers indicate when no somatic spike could be triggered. D, Integral of the total net spike (as showed in the inset), at the soma (black) and at the dendrite (red), plotted as a function of injected charge for the example shown in B. The red and black dashed lines represents fits of the data with a piecewise linear function (f(x) = 0 if x < x 0 and f(x) = α(xx 0) if xx 0). The fitted parameters α and x 0 are, respectively, the voltage gain and the current threshold for dendritic spikes. E, Voltage gains (fitted α expressed in percentage of the dendritic input resistance) in soma and dendrite for all observed dendritic spikes (n = 15).
Figure 7.
Figure 7.
Focal extracellular stimulation. A, Reconstruction of a neuron with locations of dendritic (red, d S-D = 266 μm from soma) and somatic (black) recording sites. A third pipette was used for focal extracellular stimulation just above the dendritic recording. B, Minimal (top) and maximal (bottom) EPSPs generated by trains of three focal stimulations at 20 Hz (single sweeps are shown). The inset compares time course and attenuation of minimal (light red, shorter) and maximal (dark red, longer) dendritic EPSPs. C, EPSPs generated by three pulses stimulation at 200 Hz. The inset compares the average EPSPs in the presence (black and red, shorter EPSPs) and absence (gray and light red, longer EPSPs) of the NMDA blocker d-AP5. D, EPSP amplitude in soma and dendrite as a function of stimulus strength for the 200 Hz stimulation. E, Same as D but for the EPSP integral. F, Peak amplitude and integral of the EPSP in soma (black) and dendrite (red) in d-AP5 expressed in percentage of control conditions for the example shown in A–E. G, In an example of focal stimulation, the increase of somatic EPSP amplitude with stimulation strength shows two clear steps both in control ACSF (gray) and with addition of 50 μm d-AP5 (black). H, Size of observed steps in EPSP amplitude for control ACSF and for 50 μm d-AP5. The gray dots indicate the sample average, which is not significantly different in both conditions (paired t test, p > 0.05, n = 24 steps in 8 cells). I, Same as H but for the integral of EPSPs.
Figure 8.
Figure 8.
Simulation of passive synaptic integration in pyramidal cells. A, Reconstruction of a layer 2/3 pyramidal neuron from which we made simultaneous somatic and dendritic recordings, used here for the simulation. B, Voltage response to step current injections at the soma (left) and in the dendrite (right). Simulated traces obtained from best fit of the three passive parameters are superimposed (gray line). C, Black dots, Each dot represents the ratio of dendritic to somatic amplitude (attenuation) for a single EPSC waveform injected in a given dendritic segment. All simulated segments of the apical tree for the neuron shown in A were tested to draw the figure. Red dashed line, Exponential fit of single EPSP attenuation. Gray area and solid red curve, Compound EPSPs arising from contacts located at all dendritic positions equidistant (anatomical path distance) from the soma (see sketch in the bottom right corner where synapses are indicated by red dots). The red curve represents the ratio of the mean dendritic EPSP amplitude across all injection sites to the somatic EPSP amplitude. The shading shows minimum and maximum values observed across each of the locations. D, Voltage at soma (black dots) and at synaptic locations (average over all locations, dark gray; maximum, light gray) for simultaneous activation of 10, 25, or 100 synapses randomly distributed over the apical tree. Results for the seven simulated neurons are displayed as a function of somatic input resistance. Error bars indicate the SD observed over 250 different synaptic distributions.
Figure 9.
Figure 9.
Dendritic response to minimal stimulation. A, Position of the recording electrodes (dendritic recording, d S-D = 220 μm from soma) on the reconstructed neuron (semilunar cell). A stimulation electrode was placed in the LOT. B, EPSP amplitude in soma (black) and dendrite (red). The stimulus strength was progressively increased (bottom), revealing stepwise changes in EPSP amplitude that corresponded to the recruitment of a new single fiber. The inset shows a magnification of the first amplitude step. C, Mean EPSP waveforms for the two amplitude steps. D, Histogram of the distribution of attenuation ratios for the 19 single-fiber responses observed in paired recordings. The red curve shows the expected distribution of attenuation ratio supposing that any single-fiber contacts the dendritic tree at a single locus. All recording distances (90–435 μm) are pooled together. The two distributions are significantly different (Kolmogorov–Smirnov test, p = 1.3 × 10⁻⁶). E, Two single-trial responses in the second step displaying the same somatic EPSP amplitude but different dendritic EPSP amplitudes. F, SD of EPSP amplitude at the soma and in the dendrite for the second isolated fiber computed as (variance of second step − variance of first step)0.5. The gray bar represents dendritic SD predicted from somatic SD with the assumption that the synaptic input is clustered at a single point of the dendrite. Stars indicate statistically significant difference based on a custom test (see Materials and Methods).

References

    1. Arbib MA, Erdi P, Szentagothai J. Neural organization structure, function, and dynamics. Cambridge, MA: MIT; 1998. - PubMed
    1. Bathellier B, Buhl DL, Accolla R, Carleton A. Dynamic ensemble odor coding in the mammalian olfactory bulb: sensory information at different timescales. Neuron. 2008;57:586–598. - PubMed
    1. Bi GQ, Poo MM. Synaptic modifications in cultured hippocampal neurons: dependence on spike timing, synaptic strength, and postsynaptic cell type. J Neurosci. 1998;18:10464–10472. - PMC - PubMed
    1. Brody CD, Hopfield JJ. Simple networks for spike-timing-based computation, with application to olfactory processing. Neuron. 2003;37:843–852. - PubMed
    1. Carnevale NT, Johnston D. Electrophysiological characterization of remote chemical synapses. J Neurophysiol. 1982;47:606–621. - PubMed

Publication types

LinkOut - more resources