. 2010 Mar;130(3):694-705.
doi: 10.1038/jid.2009.318. Epub 2009 Oct 8.

A TGFbeta-responsive gene signature is associated with a subset of diffuse scleroderma with increased disease severity

Affiliations

A TGFbeta-responsive gene signature is associated with a subset of diffuse scleroderma with increased disease severity

Jennifer L Sargent et al. J Invest Dermatol. 2010 Mar.

Abstract

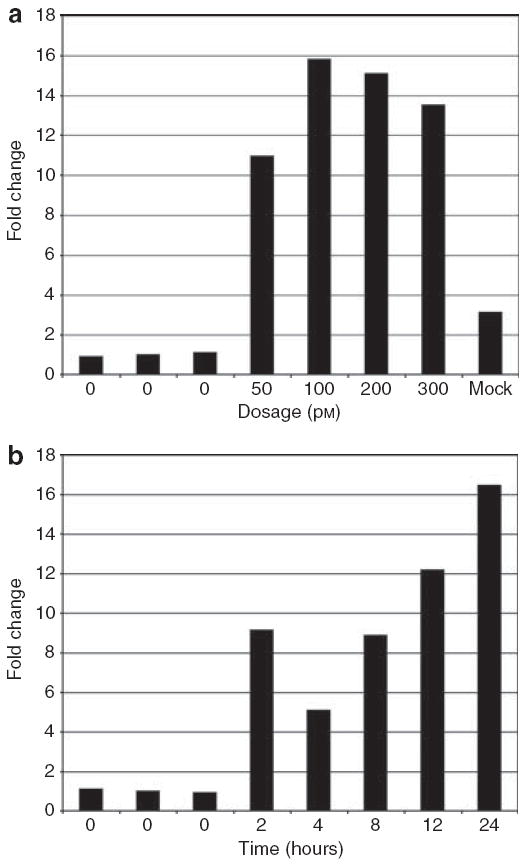
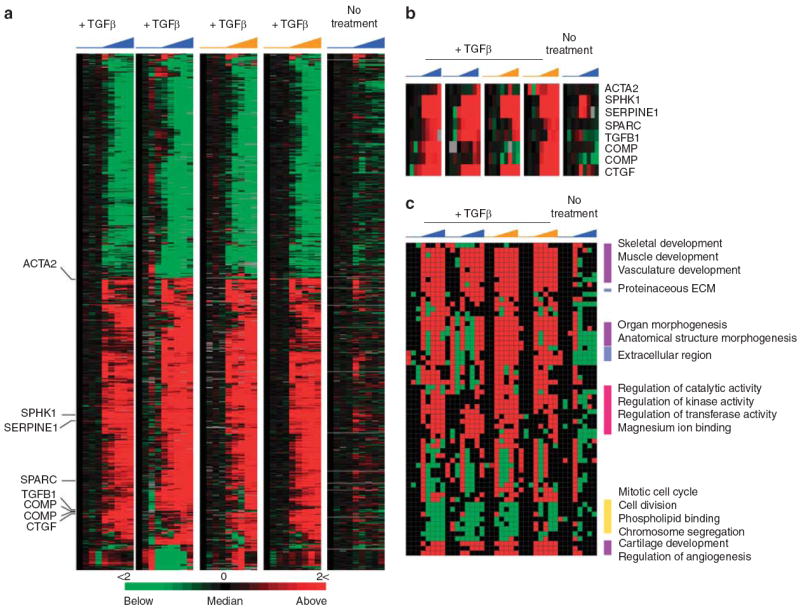
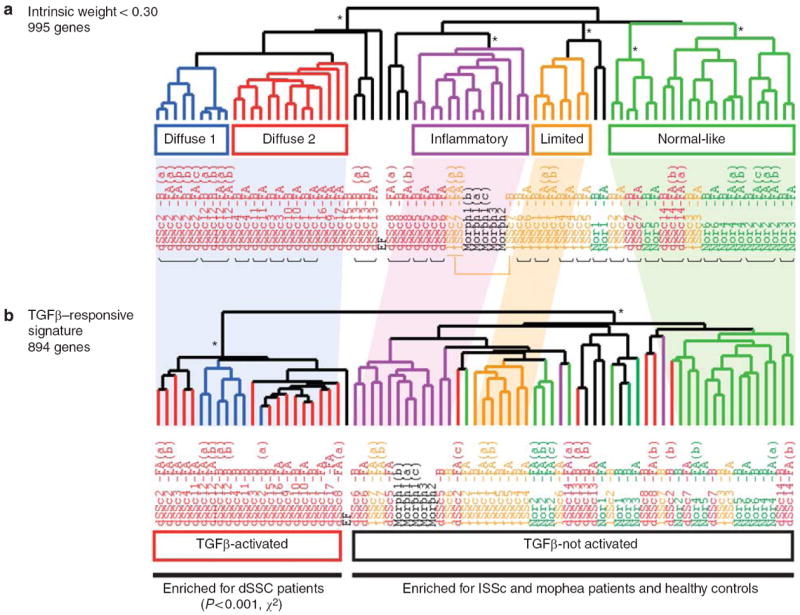
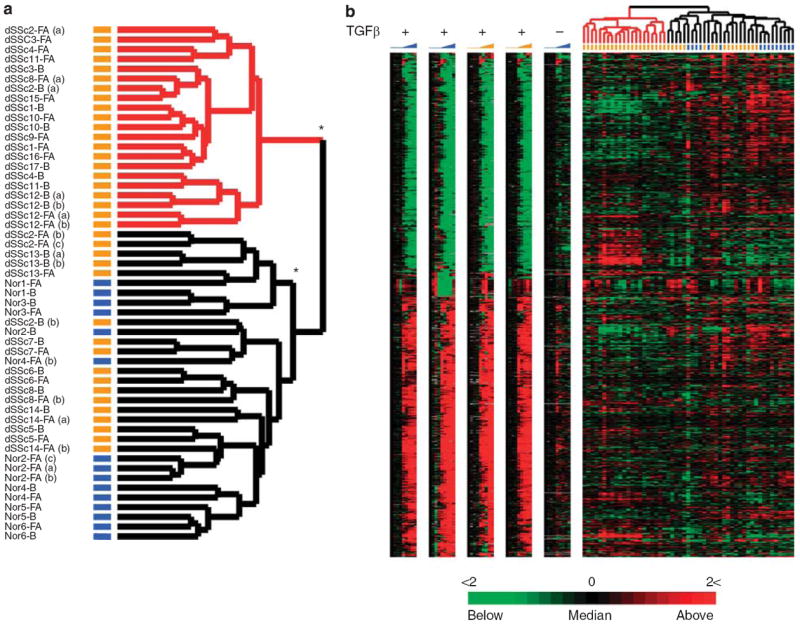
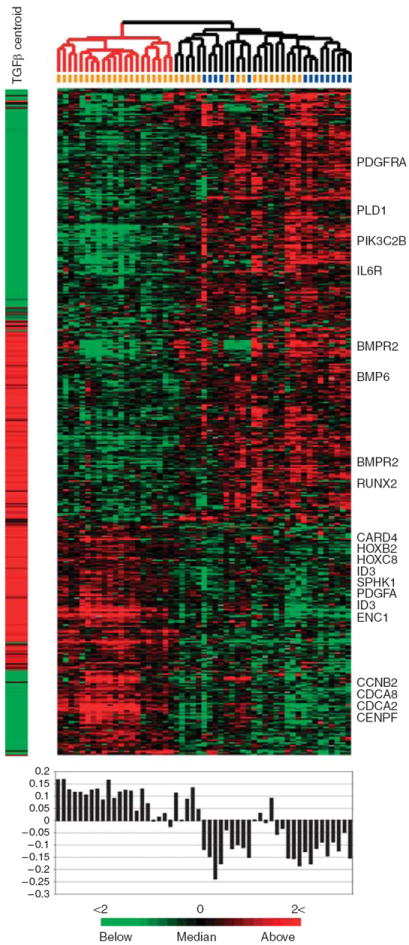
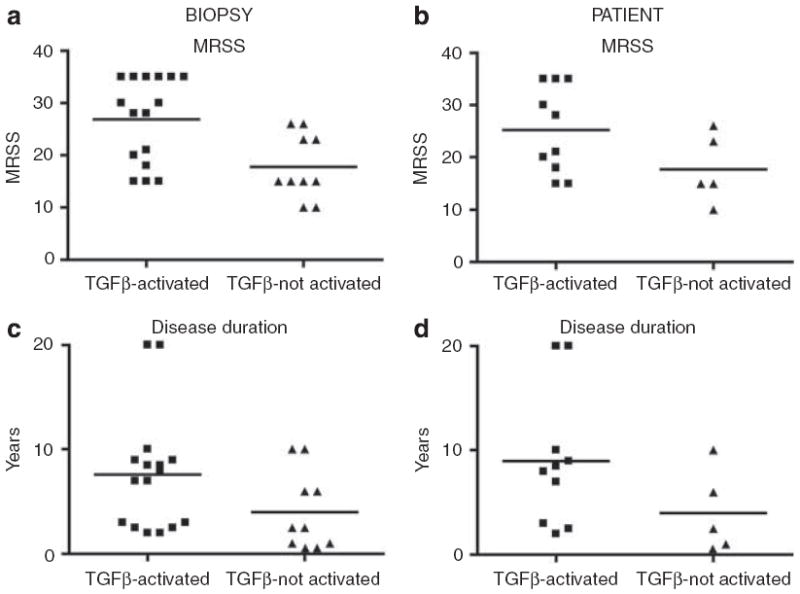
Systemic sclerosis is a complex disease with widespread skin fibrosis and variable visceral organ involvement. Since transforming growth factor-beta (TGFbeta) has been implicated in driving fibrosis in systemic sclerosis, a mechanism-derived gene expression signature was used to assay TGFbeta-responsive gene expression in the skin of patients with systemic sclerosis (SSc). Primary dermal fibroblasts from patients with diffuse SSc (dSSc) and healthy controls were treated with TGFbeta, and the genome-wide gene expression was measured on DNA microarrays over a time course of 24 hours. Eight hundred and ninety-four probes representing 674 uniquely annotated genes were identified as TGFbeta responsive. Expression of the TGFbeta-responsive signature was examined in skin biopsies from 17 dSSc, seven limited SSc (lSSc), three morphea patients, and six healthy controls. The TGFbeta-responsive signature was expressed in 10 out of 17 dSSc skin biopsies, but was not found in lSSc, morphea, or healthy control biopsies. Expression of dSSC the TGFbeta-responsive signature stratifies patients into two major groups, one of which corresponds to the "diffuse-proliferation" intrinsic subset that showed higher modified Rodnan skin score and a higher likelihood of scleroderma lung disease. The TGFbeta-responsive signature is found in only a subset of dSSc patients who could be targeted by specific therapies.


Conflict of interest statement

CONFLICT OF INTEREST

ML Whitfield has filed a patent application for gene expression biomarkers in scleroderma. This intellectual property has been licensed to a startup company, Celdara Medical, LLC, that is aiming to translate the discovery into clinical use. Dr Whitfield holds an interest in this company. The remaining authors state no conflict of interest.

Figures

Figure 1
Figure 1. Dosage and time dependence of plasminogen activator inhibitor 1 (PAI1) mRNA expression after TGFβ treatment
To optimize the concentration of TGFβ and the length of time course to analyze, cells were treated with varying doses of TGFβ, and time points were collected from 2 to 24 hours. (a) Normal dermal fibroblasts (NDFs) in 0.1% serum were treated with 50, 100, 200, or 300 pm TGFβ for 2 hours. Levels of PAI1 mRNA were measured in triplicate by Taqman qRT-PCR, normalized to 18S rRNA; fold change is relative to the average of three independent, untreated samples. (b) NDFs were treated with 50 pm TGFβ and PAI1 mRNA levels were measured in triplicate at 0, 2, 4, 8, 12, and 24 hours post-treatment. Fold change is relative to the average of the zero time points.
Figure 2
Figure 2. Genome-wide response to TGFβ in adult dermal fibroblasts
(a) Shown are the 894 probes, representing 674 annotated genes, with a 1.74-fold or greater change in expression over 24 hours following treatment with 50 pm TGFβ. Four independent primary cell cultures were treated with TGFβ, two from healthy control subjects (blue), and two from SSc patients (orange). A mock time course was performed using identical conditions with the omission of TGFβ. Time of treatment, from 0 to 24 hours, is indicated. Each row represents a probe, and each column represents a time point. (b) Expression data for the genes previously reported as being TGFβ responsive (Supplementary Table S2) and found among the 894 probes. (c) Module map of GO terms in the genome-wide response to TGFβ. Each column represents a microarray, and each row represents an enriched GO term. Only modules that were significantly enriched (P < 0.05) in at least 16 microarrays analyzed are shown. Select modules are indicated.
Figure 3
Figure 3. TGFβ-responsive genes are deregulated in the “diffuse-proliferation” subset of scleroderma
(a) Intrinsic subsets of scleroderma as described by Milano et al. (2008). (b) Organization of 75 arrays from Milano et al. by hierarchical clustering of 894 TGFβ-responsive signature genes. Shading is indicative of positioning of subsets identified by intrinsic genes relative to that identified by the TGFβ-responsive signature. *P < 0.001.
Figure 4
Figure 4. The TGFβ-responsive signature distinguishes a subset of dSSc patients
(a) Patient sample dendrogram resulting from hierarchical clustering of 53 arrays probing gene expression in skin biopsies of patients with dSSc (orange bars) and healthy control (blue bars). The samples were clustered using the 894 TGFβ-responsive probes that comprise the signature. Two major groups of samples are evident: TGFβ-activated (red) and TGFβ-not-activated (black). Technical replicates are designated by a letter (a, b or c) following patient and biopsy site identification. Statistically significant clusters as determined by SigClust are marked by *(P < 0.001). (b) Individual TGFβ time courses are aligned with the gene expression data from dSSc and healthy control biopsies, and illustrate the heterogeneity of the in vitro–derived TGFβ-responsive signature in skin biopsies.
Figure 5
Figure 5. A subset of the TGFβ-responsive signature ideally differentiates the two groups
SAM was used to identify 474 probes from the initial set of 894 probes that showed consistent, statistically significant differential expression between the TGFβ-activated and TGFβ-not-activated groups. The centroid representing the average of the TGFβ-responsive gene signature at maximal induction (12 and 24 hours) is shown to the left of the heat map. Pearson correlations between the centroid and each array were calculated and are plotted directly beneath each array.
Figure 6
Figure 6. Validation of TGFβ-responsive genes in dSSc skin
Relative mRNA levels of three genes, E2F7 (a, d), growth differentiation factor-6 (b, e), and actin-α2 (c, f) were determined using Fast Taqman qRT-PCR on select patient samples from the TGFβ-activated and TGFβ-not-activated patient groups. Trends of mRNA levels determined by qRT-PCR were reflective of those measured on DNA microarrays (d–f). All data were normalized to the mean relative expression ratio.
Figure 7
Figure 7. Distributions of MRSS and disease duration of dSSc patients
Distributions of MRSS at the time of biopsy were plotted by biopsy (a) and by patient (b) for the TGFβ-activated and TGFβ-not-activated groups. Distributions of disease duration were also plotted by biopsy (c) and by patient (d) for the two groups. P-values for all comparisons are given in Table 2.

References

    1. Akhmet-shina A, Dees C, Pileckyte M, Maurer B, Axmann R, Jungel A, et al. Dual inhibition of c-abl and PDGF receptor signaling by dasatinib and nilotinib for the treatment of dermal fibrosis. FASEB J. 2008;22:2214–22. - PubMed
    1. Barnett AJ, Miller M, Littlejohn GO. The diagnosis and classification of scleroderma (systemic sclerosis) Postgrad Med J. 1988a;64:121–5. - PMC - PubMed
    1. Barnett AJ, Miller MH, Littlejohn GO. A survival study of patients with scleroderma diagnosed over 30 years (1953–1983): the value of a simple cutaneous classification in the early stages of the disease. J Rheumatol. 1988b;15:276–83. - PubMed
    1. Baroni SS, Santillo M, Bevilacqua F, Luchetti M, Spadoni T, Mancini M, et al. Stimulatory autoantibodies to the PDGF receptor in systemic sclerosis. N Engl J Med. 2006;354:2667–76. - PubMed
    1. Chambers RC, Leoni P, Kaminski N, Laurent GJ, Heller RA. Global expression profiling of fibroblast responses to transforming growth factor-beta1 reveals the induction of inhibitor of differentiation-1 and provides evidence of smooth muscle cell phenotypic switching. Am J Pathol. 2003;162:533–46. - PMC - PubMed

Publication types

MeSH terms

Substances

Associated data