. 2009 Nov;158(5):1248-62.
doi: 10.1111/j.1476-5381.2009.00453.x. Epub 2009 Oct 8.

The end of a myth: cloning and characterization of the ovine melatonin MT(2) receptor

Affiliations

The end of a myth: cloning and characterization of the ovine melatonin MT(2) receptor

F Cogé et al. Br J Pharmacol. 2009 Nov.

Abstract

Background and purpose: For many years, it was suspected that sheep expressed only one melatonin receptor (closely resembling MT(1) from other mammal species). Here we report the cloning of another melatonin receptor, MT(2), from sheep.

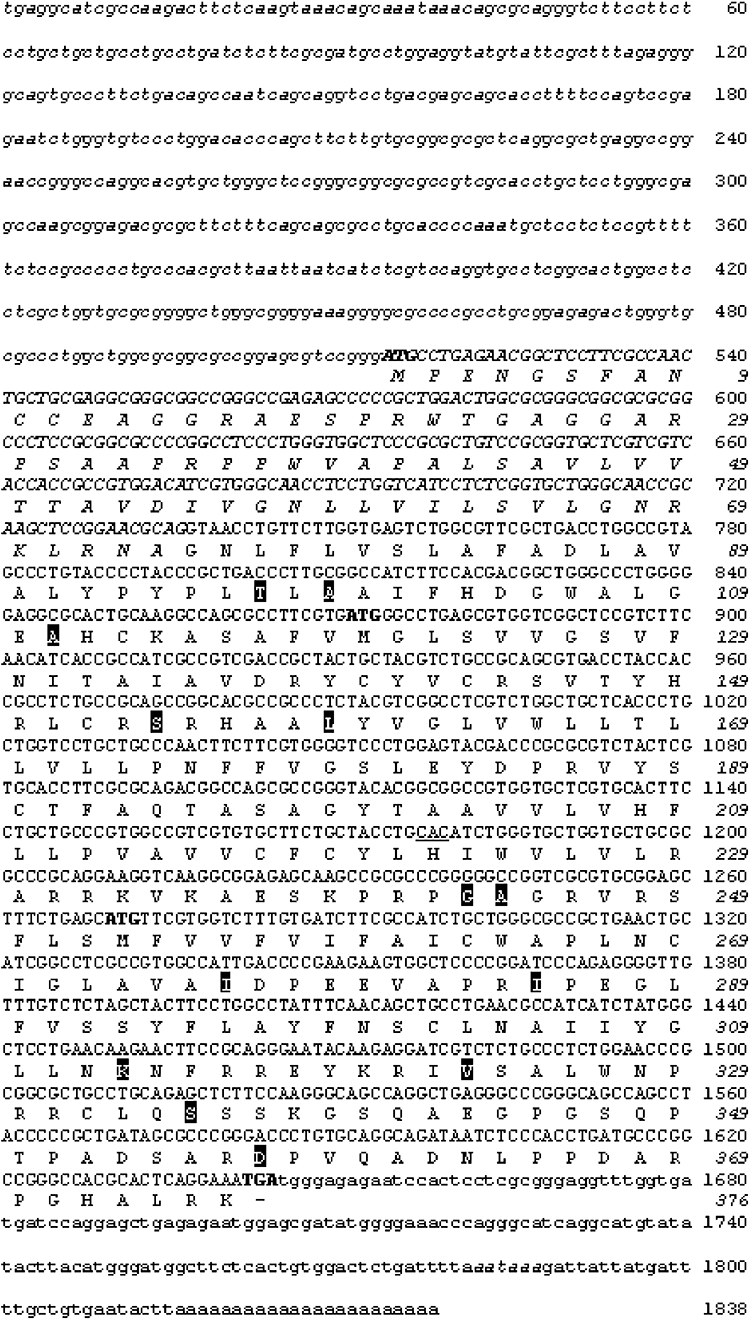
Experimental approach: Using a thermo-resistant reverse transcriptase and polymerase chain reaction primer set homologous to the bovine MT(2) mRNA sequence, we have cloned and characterized MT(2) receptors from sheep retina.

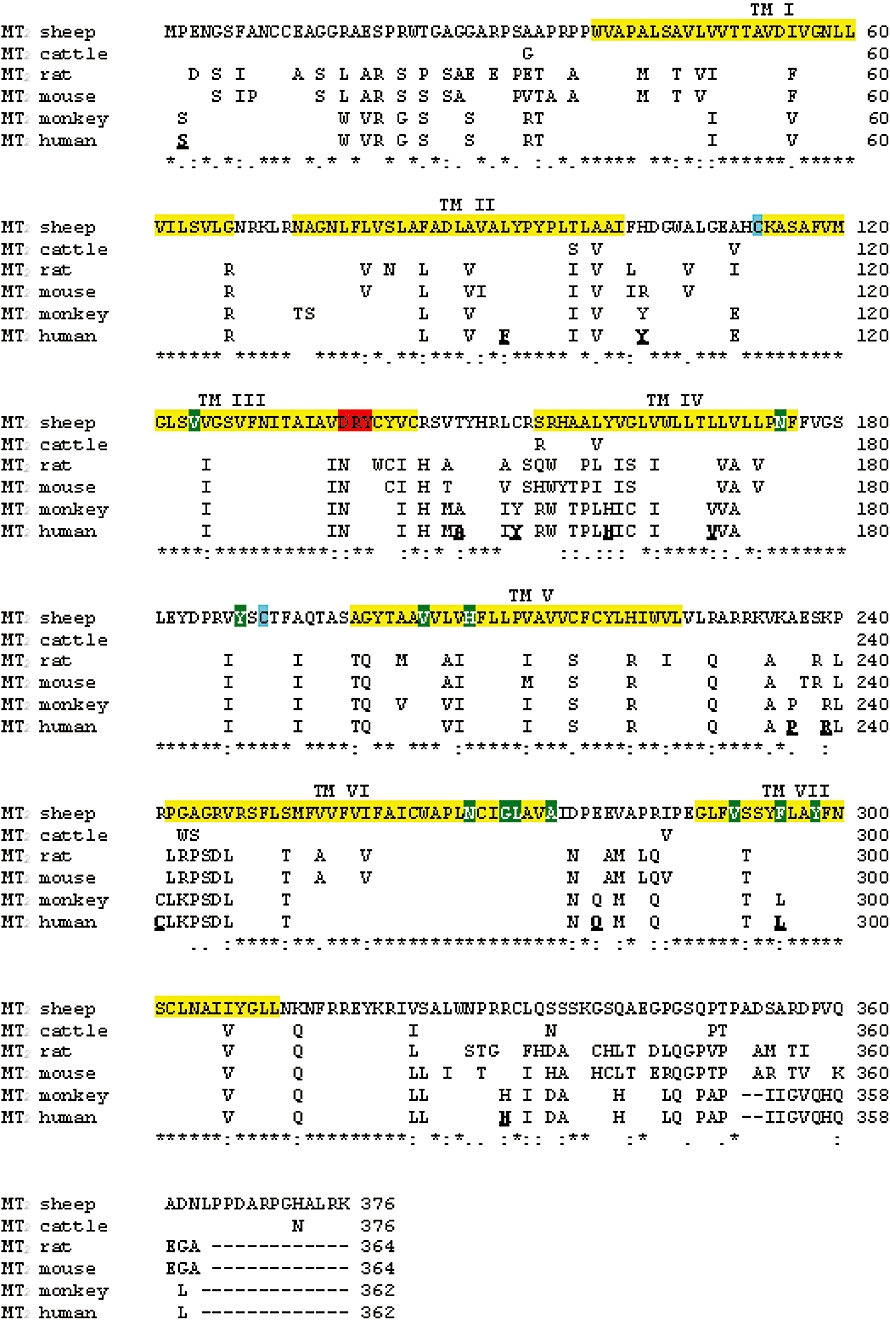
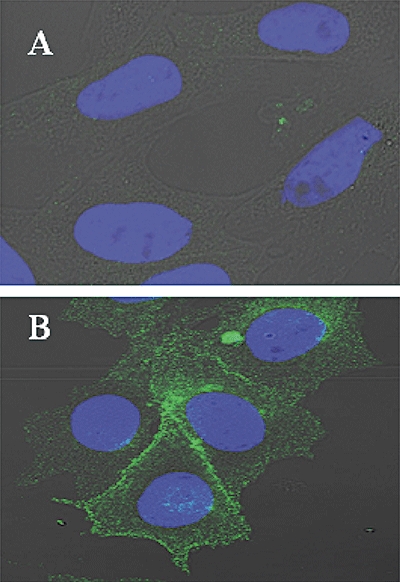
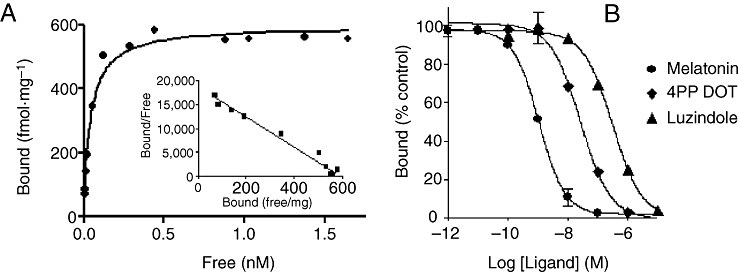
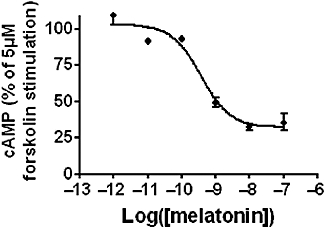
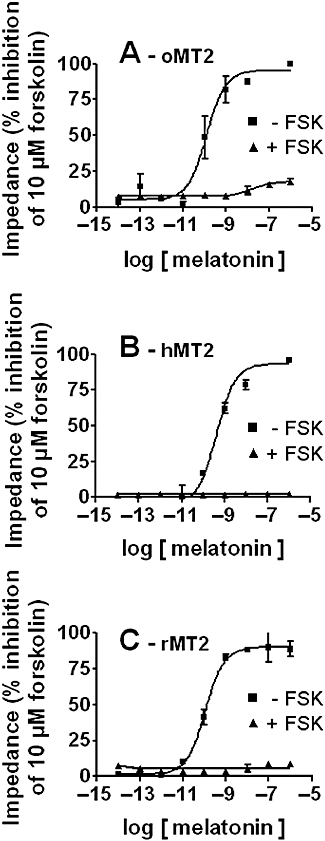
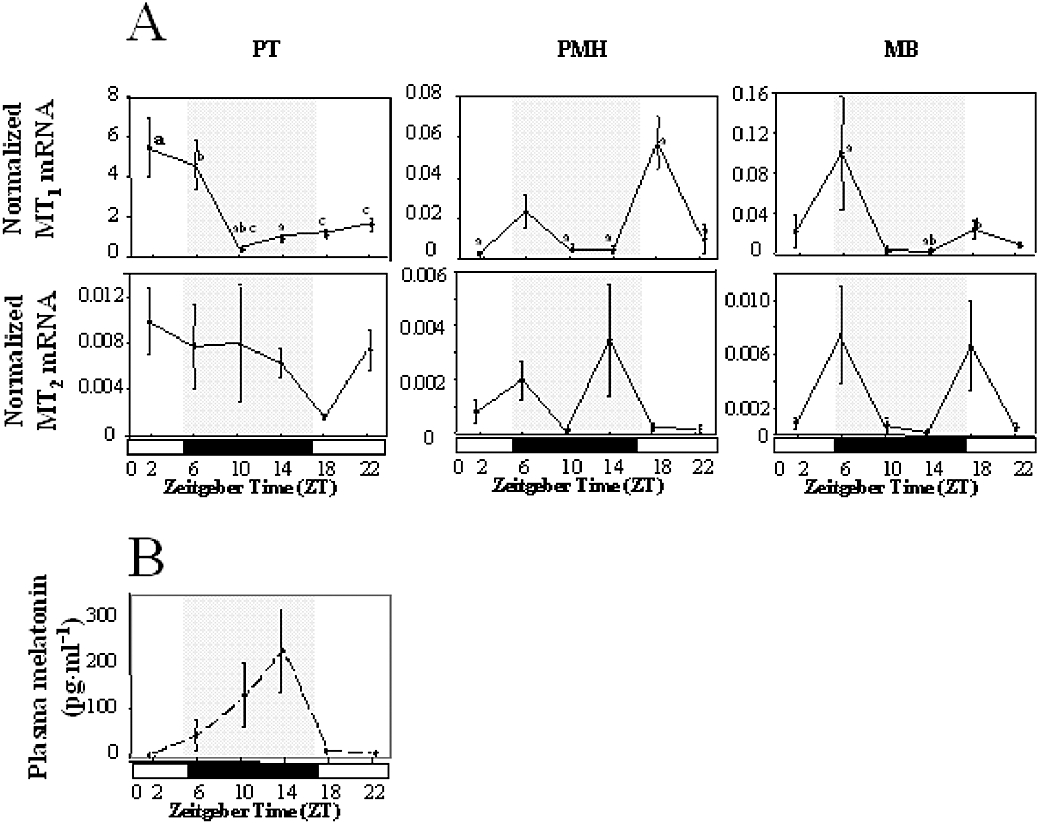
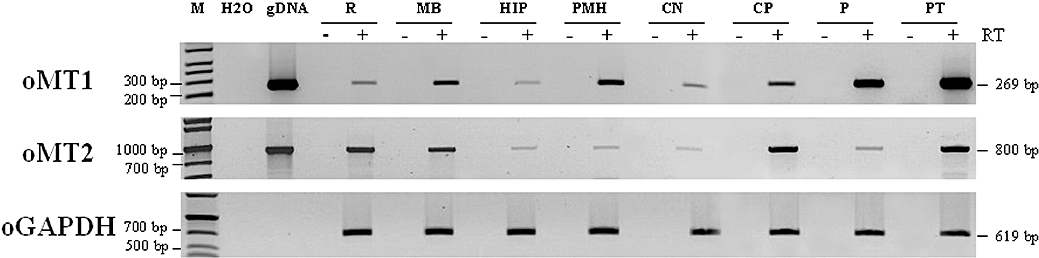
Key results: The ovine MT(2) receptor presents 96%, 72% and 67% identity with cattle, human and rat respectively. This MT(2) receptor stably expressed in CHO-K1 cells showed high-affinity 2[(125)I]-iodomelatonin binding (K(D)= 0.04 nM). The rank order of inhibition of 2[(125)I]-iodomelatonin binding by melatonin, 4-phenyl-2-propionamidotetralin and luzindole was similar to that exhibited by MT(2) receptors of other species (melatonin > 4-phenyl-2-propionamidotetralin > luzindole). However, its pharmacological profile was closer to that of rat, rather than human MT(2) receptors. Functionally, the ovine MT(2) receptors were coupled to G(i) proteins leading to inhibition of adenylyl cyclase, as the other melatonin receptors. In sheep brain, MT(2) mRNA was expressed in pars tuberalis, choroid plexus and retina, and moderately in mammillary bodies. Real-time polymerase chain reaction showed that in sheep pars tuberalis, premammillary hypothalamus and mammillary bodies, the temporal pattern of expression of MT(1) and MT(2) mRNA was not parallel in the three tissues.

Conclusion and implications: Co-expression of MT(1) and MT(2) receptors in all analysed sheep brain tissues suggests that MT(2) receptors may participate in melatonin regulation of seasonal anovulatory activity in ewes by modulating MT(1) receptor action.


Figures

Figure 2
Figure 2
Alignment comparison of primary sequence of various mammalian melatonin MT2 receptors. The deduced amino acid sequence of the ovine MT2 receptor was compared with cattle (XP_001254950), rat (XP_345900), mouse (NP_663758), human (NP_005959) and chimpanzee (XP_522146) MT2 receptor sequences. The bovine MT2 sequence (XP_001254950) used here are deduced from bovine MTNR1B gene (Loc787599 entrezgene), which presents a deletion of one adenine residue at position 1126 compared with XM_607095 sequence and which reveals a carboxy-terminal region that better matches with other MT2 of different species. The ClustalW algorithm was used to align these mammalian MT2 sequences. Amino acid residues identical in the six MT2 receptors are indicated by asterisks. Similar amino acids are indicated by dots or double dots. Amino acids not homologous to the ovine MT2 sequence are indicated under this sequence. Deleted amino acids are indicated by a dash. The seven putative transmembrane domains (TMI to VII) designed by comparison with human rhodopsin receptor crystal are highlighted in yellow on ovine MT2 sequence and numbered in roman numbers. The DRY sequence is highlighted in red. Thirteen amino acids described to be essential for 2-iodomelatonin binding to human MT2 and MT1 receptors (Conway et al., 1997; 2000; Mseeh et al., 2002; Gerdin et al., 2003; Mazna et al., 2005) are highlighted in green on the ovine MT2 sequence. Twelve residues out of the 13 are conserved in all species; only the Phe295 of human MT2 receptor is replaced by a Leu in the ovine sequence. The amino acids specific to human MT2 versus ovine/rat MT2 receptors are presented in bold and underlined. The two cysteine residues Cys113 and Cys190 engaged in a disulphide bridge between TMIII and E2 loop, necessary for structural conservation of MT2 receptors, are highlighted in blue.
Figure 1
Figure 1
Complete sequence of melatonin receptor 2 (MT2) mRNA isolated from sheep retina. The sequence of ovine retinal MT2 receptor (1838 bases) was obtained by RT-PCR using primer set derived from the bovine MT2 receptor cDNA sequence (XM_607095 and contig Ensembl ENSBTAG 00000001270). 5′UTR and 3′UTR regions of ovine MT2, obtained to 5′ and 3′ RACE experiments, correspond to 514 and 194 bases respectively. The coding region contains 1131 bases and encodes 376 amino acids. The polyadenylation signal (AATAAA) is underlined. The deduced amino acid sequence is shown using single-letter amino acid code. Nucleic and amino acid sequences are numbered on the right. The nucleic and amino acid sequences of first exon are in italic characters. The positions of the two nonsense mutations described in Siberian hamster MT2 receptor cDNA are double underlined. Amino acids described to be essential for ovine breeds polymorphisms discrimination (Xiao et al., 2007) are highlighted in black. This sequence has been deposited in the DDBJ/EMBL/GenBank nucleotide sequence databases under the accession no. EU679365.
Figure 3
Figure 3
Subcellular localization of epitope-tagged ovine MT2 receptor. Immunofluorescence studies were performed with transfected CHO-K1 cells grown on Labtech as described in the Methods section. CHO-K1 cells (A) and CHO-K1 expressing 3HA-oMT2 receptor (B) were probed with mouse monoclonal Antibody HA directed against the N-terminal epitope tag present on recombinant receptor. Experiments were carried out with paraformaldehyde-fixed and non-permeabilized cells. The fluorescence images were obtained by using Alexa 488-conjugated goat anti-mouse IgG secondary antibody. CHO-K1 cell nuclei were stained with 4′, 6′-diamidino-2-phenylindole. CHO-K1 cells transfected with the vector alone were used as a negative control (A). Magnification is 800×. Each picture is representative of five independent experiments.
Figure 4
Figure 4
Binding characteristics of ovine MT2 receptor expressed in CHO-K1 cells. Saturation binding experiments with [125I]-2-iodomelatonin (A). Specific binding is represented as a direct plot (main graph) and as a Scatchard plot of the specific binding (inset). Competition binding experiments against [125I]-2-iodomelatonin (B). Ligands evaluated are melatonin, 4-phenyl-2-propionamidotetraline (4P-PDOT) and luzindole. Points shown are from representative experiments performed in triplicates and repeated four times.
Figure 5
Figure 5
Modulation of forskolin-stimulated cAMP accumulation by the 3HA-tagged ovine MT2 receptor in CHO-K1 cells. CHO-K1 cells stably transfected with ovine MT2 receptor cDNA were stimulated with forskolin (5 µM) in the presence of the indicated concentrations of melatonin. Intra-cellular cAMP levels were determined as described in the Methods section. Data represent the means ± SEM of three independents experiments performed in triplicate and repeated three times. Data are expressed as per cent of mean forskolin-stimulated value (100%). The potency of melatonin in this assay was 0.81 ± 0.62 nM. Control native CHO-K1 cells did not respond to melatonin in this assay (not represented).
Figure 6
Figure 6
Subtype of G protein coupling of ovine MT2 receptor. Cellular dielectric spectroscopy of CHO-K1/3HA-oMT2 cells stimulated by melatonin showed a direct increase in impedance, typical of a Gi coupling [see Verdonk et al. (2006) for theory and examples]. Melatonin stimulation of CHO-K1 cells expressing ovine MT2 receptors (A) was compared with CHO-K1 cells expressing either human MT2 (B) or rat MT2 (C) receptors. A dose–response of melatonin was obtained alone or after pre-treatment of cells with Pertussis toxin.
Figure 8
Figure 8
Circadian variation in expression of mRNA for MT1 and MT2 receptors in sheep brain tissues. Light–dark variations in MT1 and MT2 mRNA expression in sheep brain tissues. Tissues and blood were collected at six time points of the day–night cycle (ZT 1.5, 6, 10.5, 13.5, 18 and 22.5 (n= 5 structures per condition) and light–dark variations in MT1 and MT2 mRNA expression in the sheep pars tuberalis (PT), premammillary hypothalamus (PMH) and mammillary bodies (MB) were analysed. For each sample, the data were normalized to the median value for exogenous luciferase. The gene/luciferase values were then compared through ZT and genes within tissues. Normalized expression level of ovine MT1, ovine MT2 mRNA (A) and plasma melatonin concentrations (pg·mL−1, B) were measured to estimate the daily changes in these parameters. Data are presented as the mean ± SEM and mean values with different letters are significantly different (anova, P < 0.05). Open bars and shaded areas as well as solid bars represent the light and the dark phases respectively.
Figure 7
Figure 7
Distribution of mRNA melatonin receptors MT1 and MT2 in sheep brain tissues. Animals were killed between 06:00 and 12:00 h (late night and morning). Total RNA (4 µg) of sheep retina (R), mammillary bodies (MB), hippocampus (HIP), premammillary hypothalamus (PMH), caudate nucleus (CN), choroid plexus (CP), pineal gland (P) and pars tuberalis (PT) was amplified by RT-PCR as described in the experimental section. After 35 PCR cycles for ovine MT1 and MT2 receptors (oMT1 and oMT2) and 25 cycles for ovine GAPDH (oGAPDH), PCR products were analysed using a 2%w/v agarose gel stained with ethidium bromide. Control experiments without reverse transcriptase (–) revealed no product. The lengths of amplicons were estimated by molecular mass markers (Gel Pilot 1 kb Plus Ladder; M) and indicated in base pairs (bp) on the right. Each PCR product was purified and identified by sequencing on both strands. GAPDH amplification was used as an internal standard. Each picture is representative of three independent experiments.

References

    1. Alarma-Estrany P, Pintor J. Melatonin receptors in the eye: location, second messengers and role in ocular physiology. Pharmacol Ther. 2007;113:507–522. - PubMed
    1. Alexander SPH, Mathie A, Peters JA. Guide to Receptors and Channels (GRAC), 3rd edition (2008 revision) Br J Pharmacol. 2008;153:S1–S209. - PMC - PubMed
    1. Arendt J. Melatonin: characteristics, concerns, and prospects. J Biol Rhythms. 2005;20:291–303. - PubMed
    1. Audinot V, Mailliet F, Lahaye C, Bonnaud A, Le Gall A, Amosse A, et al. New selective ligands of human cloned melatonin MT1 and MT2 receptors. Naunyn Schmiedebergs Arch Pharmacol. 2003;367:553–561. - PubMed
    1. Audinot V, Bonnaud A, Grandcolas L, Rodriguez M, Nagel N, Galizzi JP, et al. Molecular cloning and binding characteristics of rat melatonin MT1 and MT2 receptors. Biochem Pharmacol. 2008;75:2007–2015. - PubMed

Publication types

MeSH terms

LinkOut - more resources