. 2009;10(10):R108.
doi: 10.1186/gb-2009-10-10-r108. Epub 2009 Oct 8.

Genomic DNA k-mer spectra: models and modalities

Affiliations

Genomic DNA k-mer spectra: models and modalities

Benny Chor et al. Genome Biol. 2009.

Abstract

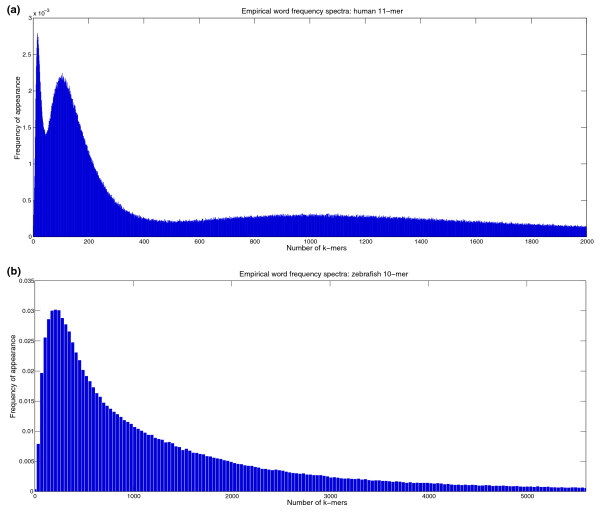
Background: The empirical frequencies of DNA k-mers in whole genome sequences provide an interesting perspective on genomic complexity, and the availability of large segments of genomic sequence from many organisms means that analysis of k-mers with non-trivial lengths is now possible.

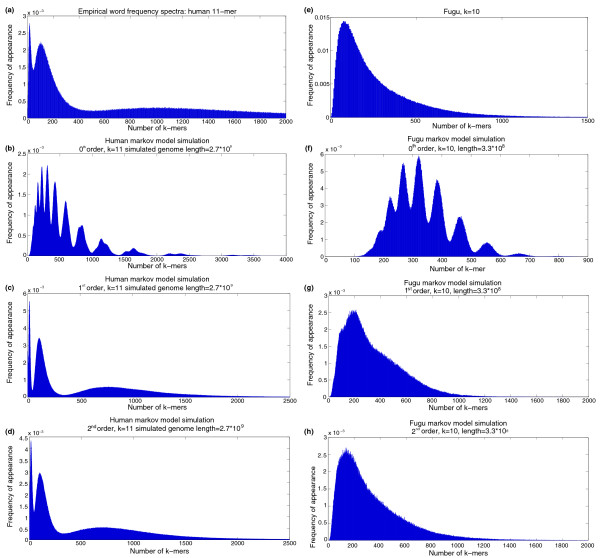
Results: We have studied the k-mer spectra of more than 100 species from Archea, Bacteria, and Eukaryota, particularly looking at the modalities of the distributions. As expected, most species have a unimodal k-mer spectrum. However, a few species, including all mammals, have multimodal spectra. These species coincide with the tetrapods. Genomic sequences are clearly very complex, and cannot be fully explained by any simple probabilistic model. Yet we sought such an explanation for the observed modalities, and discovered that low-order Markov models capture this property (and some others) fairly well.

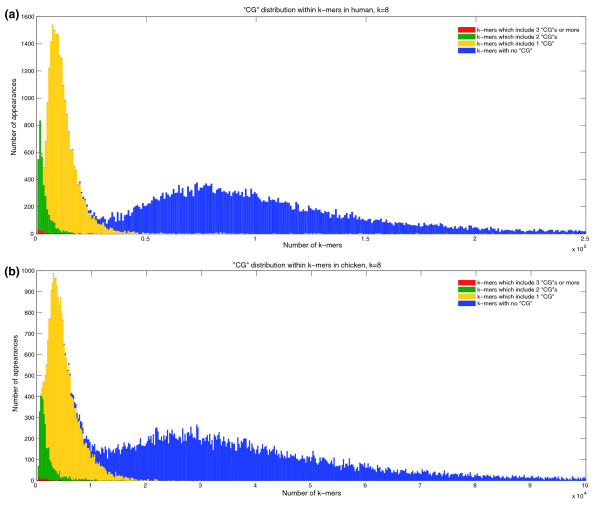
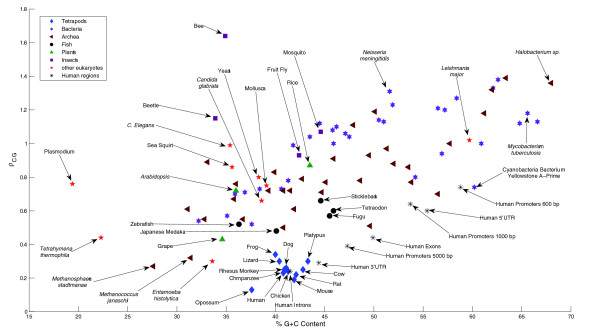
Conclusions: Multimodal spectra are characterized by specific ranges of values of C+G content and of CpG dinucleotide suppression, a range that encompasses all tetrapods analyzed. Other genomes, like that of the protozoa Entamoeba histolytica, which also exhibits CpG suppression, do not have multimodal k-mer spectra. Groupings of functional elements of the human genome also have a clear modality, and exhibit either a unimodal or multimodal behaviour, depending on the two above mentioned values.


Figures

Figure 1
Figure 1
Empirical spectra of human and zebrafish. Empirical word frequency spectra showing the two types of behavior described in this paper. The x-axis is the abundance of k-mers, and the y-axis describes the frequency of words with that abundance in the relevant genome. (a) Human genome 11-mers (0 ≤ x ≤ 2,000 occurrences), exhibiting multimodal behavior. (b) Zebrafish genome 10-mer distribution (0 ≤ x ≤ 5,500 occurrences), with a unimodal distribution.
Figure 2
Figure 2
Simulated spectra from Markov models. Markov model simulations of the k-mer spectra of (a-d) human 11-mers and (e-h) Fugu 10-mers. For each species four graphs are shown: the empirical histograms, zero-order Markov model, first-order Markov model, and second-order Markov model. Simulation sequence length was equal to that of the original genome for each species.
Figure 3
Figure 3
The copy/insert process does not always produce a heavy tailed spectrum. Effect of (a) increasing length of initial genome and (b) adding mutation to the copy/insert process. Graphs show the 11-mer spectrum of simulated genomes with (a) length equal to human chromosome 5, generated using a copy/insert process varying initial genome length, and (b) length 4 Mb, with a proportion of the bases mutated after each insert from an initial genome of 5,000 bp. As both axes are on a logarithmic scale, a distribution with a heavy 'power-law' tail (for example, no mutation) will tend to be a straight line, whereas lighter 'exponential' tails will bend downwards (for example, Bernoulli sequence). The sequences were constructed from an initial genome generated from a Bernoulli sequence with a CG content of 38.5%, matching human chromosome 5, by copying 33 base long chunks.
Figure 4
Figure 4
k-mer spectra of human and chicken, partitioned according to number of CpG dinucleotides in k-mers. k-mers with multiple CpGs are dominant among rare k-mers in the spectra of (a) human, and (b) chicken (k = 11). The 11-mer spectra are color-coded: blue, 11-mers with no CpG dinucleotides; yellow, exactly one CpG; green, exactly two CpG instances; red, three CpG instances or more.
Figure 5
Figure 5
Distribution of CpG suppression and CG content of genomes studied. Distribution of CpG suppression, measured by ρCG, against the CG content of many genomes; evolutionarily interesting groups are differentiated by symbols. Notice that the tetrapods, all of whose genomes have multimodal k-mer spectra, form a tight grouping in the lower middle part of the graph. The three closest partitions of human genomic sequence, the introns, 3' UTRs and promoter regions (5,000 bp upstream of the 5' UTR), also have multimodal k-mer spectra. Other nearby genomes, Entamoeba histolytica and Japanese medaka (Oryzias latipes), as well as other kinds of human genomic sequences (exons, 5' UTRs, and shorter promotor regions) have unimodal spectra.

References

    1. Robin S, Schbath S. Numerical comparison of several approximations of the word count distribution in random sequences. J Comput Biol. 2001;8:349–359. - PubMed
    1. Reinert G, Schbath S, Waterman MS. Probabilistic and statistical properties of words: an overview. J Comput Biol. 2000;7:1–46. - PubMed
    1. Otaki JM, Ienaka S, Gotoh T, Yamamoto H. Availability of short amino acid sequences in proteins. Protein Sci. 2005;14:617–625. - PMC - PubMed
    1. Tuller T, Chor B, Nelson N. Forbidden penta-peptides. Protein Sci. 2007;16:2251–2259. - PMC - PubMed
    1. el antri S, Bittoun P, Mauffret O, Monnot M, Convert O, Lescot E, Fermandjian S. Effect of distortions in the phosphate backbone conformation of six related octanucleotide duplexes on CD and 31P NMR spectra. Biochemistry. 1993;32:7079–7088. - PubMed

Publication types