

doi: 10.1186/gb-2009-10-10-r109.
Epub 2009 Oct 8.
A compiled and systematic reference map of nucleosome positions across the Saccharomyces cerevisiae genome
Affiliations
- PMID: 19814794
- PMCID: PMC2784324
- DOI: 10.1186/gb-2009-10-10-r109
Item in Clipboard
A compiled and systematic reference map of nucleosome positions across the Saccharomyces cerevisiae genome
Genome Biol.
2009.
Abstract
Nucleosomes have position-specific functions in controlling gene expression. A complete systematic genome-wide reference map of absolute and relative nucleosome positions is needed to minimize potential confusion when referring to the function of individual nucleosomes (or nucleosome-free regions) across datasets. We compiled six high-resolution genome-wide maps of Saccharomyces cerevisiae nucleosome positions from multiple labs and detection platforms, and report new insights. Data downloads, reference position assignment software, queries, and a visualization browser are available online http://atlas.bx.psu.edu/.
Figures
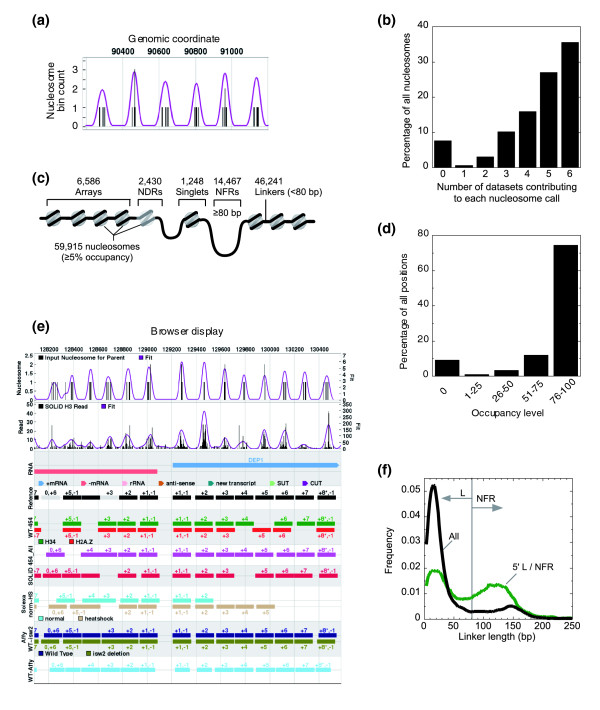
A consensus of consensus nucleosome calls defines the nucleosome reference map. (a) Screen shot of six consensus nucleosome calls (vertical bars) in which each is a consensus of positions from six datasets (five datasets for positions 1 and 4). Shown is chromosome 11 (loci 90200 to 91200). Narrower peaks have a stronger consensus. The trace indicates the probability landscape for a reference nucleosome. (b) Bar graph of the number of datasets contributing to the set of reference nucleosome positions (including hypothetical positions). (c) Illustration of the types of nucleosomes in the yeast genome, and their specifications. (d) Bar graph indicating nucleosome occupancy level throughout the genome at quartile intervals. (e) Browser screen shot of consensus nucleosome positions from 128000 to 130600 at chromosome 1. Any location can be queried online [21]. The top track, indicated as 'RNA', provides coordinates of different types of RNA transcripts as color-coded by the legend immediately under it. The 'Reference' track provides the location and the positional number of the reference nucleosome calls. The darkness of the box indicates the mode-normalized nucleosomal occupancy: light gray, < 5% (that is, in NFRs); intermediate gray, 5 to 50% (that is, in nucleosome-depleted regions); dark gray, 50 to 100%; black, 100%. The remaining six sets of tracks represent the individual consensus calls from datasets 1 to 6 (see Materials and methods). Within each set, additional nucleosome subsets are shown (for example, H2A.Z nucleosomes, nucleosomes from heat-shocked cells, and nucleosomes from an isw2 deletion strain). One nucleosome may have multiple names (for example, '+1,-1') when it is associated with more than one gene (exemplified in red boxes). Asterisks indicate this nucleosome is the terminal one to its associated gene (that is, the last one at the 3' end of the gene). (f) Smoothed frequency distribution of all linker lengths and only those found at the 5' end of genes.
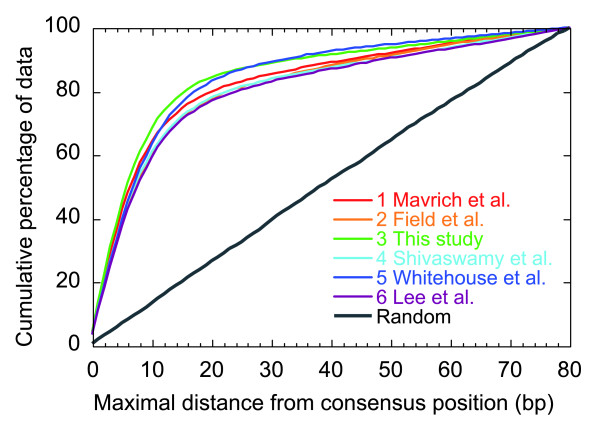
Cumulative error associated with the six sets of input nucleosomes compared against the reference set. The error interval is the midpoint distance between the reference nucleosome and the query nucleosome. Only those reference nucleosomes that were contributed by all six datasets were used in the error analysis. Each dataset is described in Table 1.
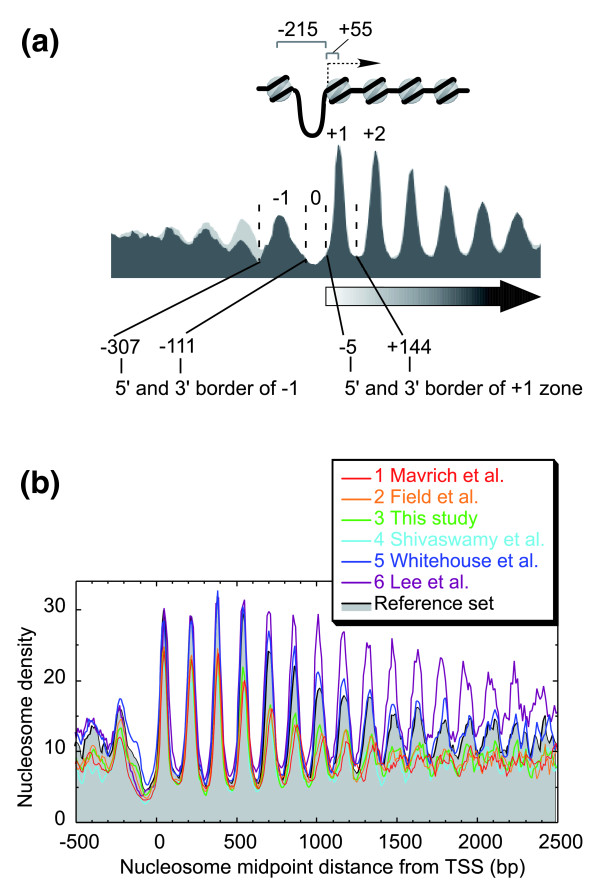
The canonical -1, NFR, +1, +2, etc. nucleosome organization around the TSS is preserved in all datasets. (a) Illustration pointing out the -1, 0, +1 zones for systematic naming of nucleosome positions. Also shown is the distance from the TSS to the -1 and +1 nucleosomes. (b) Distribution of nucleosome calls in each of the six datasets around the TSS. Only nucleosomes having >50% occupancy were considered. The reference set is shown as a gray-filled plot. Note that sets 5 and 6 represent hidden Markov modeling or Pearson best fit of tiling array data, and thus represent modeled positions, based upon measured periodicities. Consensus positioning at further distances from the TSS may be artificially maintained in those datasets.
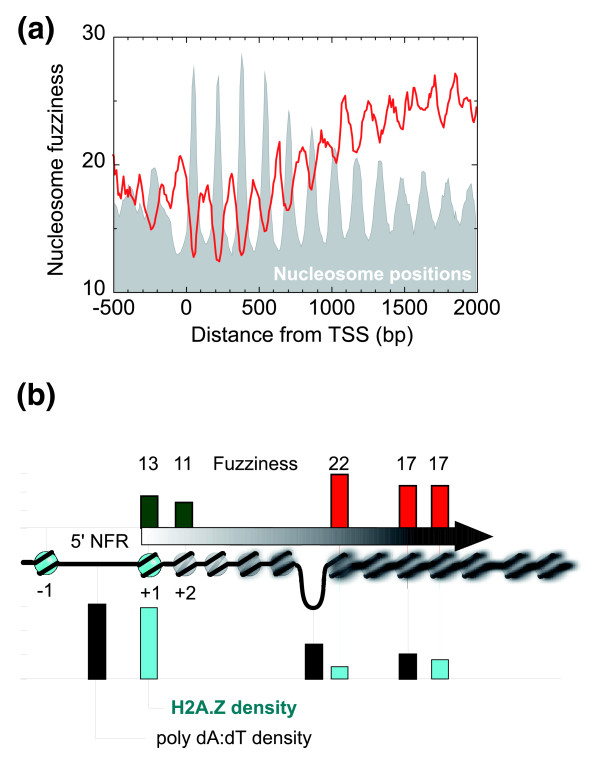
Nucleosome fuzziness relative to TSS. (a) Fuzziness is reported as the standard deviation of the six input nucleosome locations for each individual reference nucleosome. Nucleosome distances from the TSS were binned in 10-bp intervals, and the distribution smoothed using a three-bin moving average. Nucleosomes were required to have at least 50% occupancy and be called by at least four of the datasets. (b) Illustration of a nucleosomal array and NFRs (≥147 bp) with particular emphasis on border nucleosomes at the 5' end of genes (+1 position) in comparison with those elsewhere in the genome (that is, not at positions -1 through +4, nor at the end of genes nor in intergenic regions; nucleosomes were required to have ≥50% occupancy and be called by at least five datasets). Shown are bar graphs of quantitative measures of nucleosome fuzziness, H2A.Z/H3-H4 ratios, and poly dA:dT (A≥5 or T≥5) density in all nucleosomes or NFRs (≥147 bp) having the illustrated property (border versus non-border nucleosomes, and 5' NFR versus genic NFRs).
References
Publication types
MeSH terms
Substances
Grants and funding
LinkOut - more resources
Full Text Sources
Molecular Biology Databases
