. 2010 Jan;221(1):38-53.
doi: 10.1016/j.expneurol.2009.09.028. Epub 2009 Oct 6.

A bilateral cervical contusion injury model in mice: assessment of gripping strength as a measure of forelimb motor function

Affiliations

A bilateral cervical contusion injury model in mice: assessment of gripping strength as a measure of forelimb motor function

Roberto M Aguilar et al. Exp Neurol. 2010 Jan.

Abstract

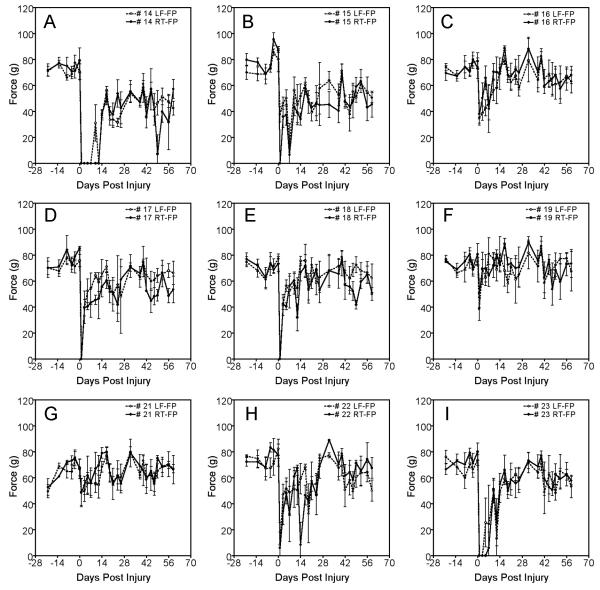
Here, we describe a bilateral cervical contusion model for mice. Adult female mice received graded bilateral contusion injuries at cervical level 5 (C5) using a commercially available impactor (the IH device). Three separate experiments were carried out to define conditions that produce impairments in forelimb function without unacceptable impairment of general health. A grip strength meter (GSM) was used to assess gripping ability as a measure of forelimb motor function; lesion size was assessed histologically by staining cross sections for H&E and GFAP. In Experiment 1, mice received injuries of 30 kilodynes (kdyn); these produced minimal deficits on grip strength. In Experiment 2, mice received injuries of 75 kdyn and 100 kdyn. Injuries of 75 kdyn produced transient deficits in gripping that recovered between 3 and 15 days post-injury (dpi) to about 90% of control; injuries of 100 kdyn produced deficits that recovered to about 50% of control. In Experiment 3, none of the mice that received injuries of 100 kdyn recovered gripping ability. Histological assessment revealed graded injuries that ranged from damage limited primarily to the dorsal column (DC) to damage to the DC, grey matter, ventral column and lateral column. Most lesions filled in with a fibrous tissue matrix, but fluid-filled cystic cavities were found in 13% of the 100 kdyn injury group and a combination of fibrous-filled/fluid-filled cystic cavities were found in 22% and 38% of the 75-kdyn and 100-kdyn injury groups, respectively. There was minimal urine retention following cervical contusion injuries indicating preservation of bladder function. Our results define conditions to produce graded bilateral cervical contusion injuries in mice and demonstrate the usefulness of the GSM for assessing forelimb motor function after cervical contusions.


Figures

Figure 1
Figure 1
Individual forepaw grip strength before and after a 30 kdyn bilateral contusion injury at C5. Panels A-I represent mouse numbers 2, 3, 5, 6, 8, 9, 10, 15 and 17 from Experiment 1, respectively. Open circles with dashed lines represent the grip strength of mice when pulling the bar with their left forepaw. Filled circles with solid lines represent the grip strength of mice when pulling the bar with their right forepaw. Data represents mean ± standard deviation.
Figure 2
Figure 2
Combined individual grip strength data from sham operated mice (black; n=3) and mice that received a 30 kdyn bilateral contusion injury at C5 (green; n=9) in Experiment 1. Open circles with the dashed line represent the grip strength from mice that pulled the bar with their left forepaw. Closed circles with the solid line represent the grip mice that pulled the bar with their right forepaw. Data represents mean ± standard error of the mean.
Figure 3
Figure 3
Individual forepaw grip strength before and after a 75 kdyn bilateral contusion injury at C5. Panels A-I represent mouse numbers 14, 15, 16, 17, 18, 19, 21, 22, and 23 from Experiment 2, respectively. Open circles with dashed lines represent the grip strength of mice that pulled the bar with their left forepaw. Filled circles with solid lines represent the grip strength of mice that pulled the bar with their right forepaw. Data represents mean ± standard deviation.
Figure 4
Figure 4
Dual forepaw grip strength before and after a 75 kdyn bilateral contusion injury at C5 from individual mice. Panels A-I represent mouse numbers 14, 15, 16, 17, 18, 19, 21, 22 and 23 from Experiment 2, respectively. Data represents mean ± standard deviation.
Figure 5
Figure 5
Individual forepaw grip strength before and after a 100 kdyn bilateral contusion injury at C5. Panels A-H represent mouse numbers 2, 4, 6, 7, 8, 9, 10, and 11 from Experiment 2, respectively. Open circles with dashed lines represent the grip strength of mice that pulled the bar with their left forepaw. Filled circles with solid lines represent the grip strength of mice that pulled the bar with their right forepaw. Data represents mean ± standard deviation.
Figure 6
Figure 6
Dual forepaw grip strength before and after a 100 kdyn bilateral contusion injury at C5 from individual mice. Panels A-H represent mouse numbers 2, 4, 6, 7, 8, 9, 10, and 11 from Experiment 2, respectively. Data represents mean ± standard deviation.
Figure 7
Figure 7
Combined grip strength data from Experiment 2 illustrating individual forepaw grip strength (Panel A) and dual forepaw grip strength (Panel B) from the Sham Laminectomy Control group (black; n = 2), 75 kdyn injury group (blue; n = 9) and the 100 kdyn injury group (red; n = 8). In Panel A, the open circles with the dashed lines represent the left forepaw grip strength and the filled circles with the solid lines represent the right forepaw grip strength per group. In Panel B, black, blue, and red lines represent the grip strength of both forepaws pulling from the Sham Laminectomy Control group, 75 kdyn injury group, and the 100 kdyn injury group, respectively. Data represents mean ± standard error of the mean.
Figure 8
Figure 8
Combined grip strength data from Experiment 3 illustrating individual forepaw grip strength (Panel A) and dual forepaw grip strength (Panel B) from the 100 kdyn injury group (n = 16). In Panel A, the red open circles with the dashed red lines represent the left forepaw grip strength from the 100 kdyn injury group. Red filled circles with the solid red lines represent the right forepaw grip strength from the 100 kdyn injury group. In Panel B, the red solid circles with red solid lines represent the dual forepaw grip strength from the 100 kdyn injury group. Data represents mean ± standard error of the mean.
Figure 9
Figure 9
The Mouse Pectoral Hair Loss Scale (mPHLS). Panel A illustrates the mPHLS on mouse drawings displaying the mouse's Right Ventral Side (RVS) and Left Ventral Side (LVS). Each ventral side is scored independent of each other. Level “0” = no apparent hair loss. Level “1” = hair loss in the medial forearm only. Level “2” = hair loss in the medial and lateral forearm. Level “3” = hair loss in the entire forelimb (distal and proximal) up to the shoulder. Level “4” = hair loss in the entire forelimb past the shoulder and extending toward the midline of the chest. Level “5” = hair loss in the entire arm, chest, and extending down toward the abdomen. Panel B illustrates mouse examples of hair loss after 100 kdyn contusion injuries at C5 using the mPHLS.
Figure 10
Figure 10
Representative examples of hair loss using the mPHLS in mice that received a 100 kdyn injury in Experiment 3. Panels A, B, C represent the hair loss in mouse #10, mouse #20 and mouse #17, respectively. Panel D represents the combined hair loss data from Experiment 3. Open circles with the dashed line represent the Left Ventral Side (LVS) and the solid circles with the solid line represent the Right Ventral Side (RVS). In Panels A-C, data represents individual recordings and in Panel D, data represents the mean ± SEM.
Figure 11
Figure 11
Representative examples of lesion size at the lesion epicenter from the 75 kdyn and 100 kdyn injury groups in Experiments 2 and 3 using GPAP immunostained tissue (Panels A, B, E, and F) and H&E stained tissue (Panels C, D, G, and H). Mouse #17 from Experiment 2 is illustrated in Panels A and C; mouse #16 from Experiment 2 is illustrated in Panels B and D; mouse #6 from Experiment 2 is illustrated in Panels E and G; and mouse #26 from Experiment 3 is illustrated in Panels F and H. Scale bar = 250 μm.
Figure 12
Figure 12
Comparisons of lesion size and lesion length at the lesion epicenters against increasing injury forces (Panel A and B) and final grip strength measurement per group (Panel C and D) from Experiments 2 and 3. Data is plotted as individual cases with means ± standard error of the mean. Student's t-test was used for statistical analysis: * = p<0.0144; ** = p<0.0393; *** = p<0.001.

References

    1. One degree of separation: Paralysis and spinal cord injury in the United States. Christopher and Dana Reeve Foundation; 2009. pp. 1–24.
    1. Anderson KD. Targeting recovery: priorities of the spinal cord-injured population. J Neurotrauma. 2004;21:1371–1383. - PubMed
    1. Anderson KD, Abdul M, Steward O. Quantitative assessment of deficits and recovery of forelimb motor function after cervical spinal cord injury in mice. Exp Neurol. 2004;190:184–191. - PubMed
    1. Anderson KD, Sharp KG, Steward O. Bilateral cervical contusion spinal cord injury in rats. Exp Neurol. 2009 In Press. - PMC - PubMed
    1. Basso DM, Fisher LC, Anderson AJ, Jakeman LB, McTigue DM, Popovich PG. Basso Mouse Scale for locomotion detects differences in recovery after spinal cord injury in five common mouse strains. J Neurotrauma. 2006;23:635–659. - PubMed

Publication types

Substances