. 2010 Jun;69(6):1208-13.
doi: 10.1136/ard.2009.108043. Epub 2009 Oct 7.

Novel expression signatures identified by transcriptional analysis of separated leucocyte subsets in systemic lupus erythematosus and vasculitis

Affiliations

Novel expression signatures identified by transcriptional analysis of separated leucocyte subsets in systemic lupus erythematosus and vasculitis

Paul A Lyons et al. Ann Rheum Dis. 2010 Jun.

Abstract

Objective: To optimise a strategy for identifying gene expression signatures differentiating systemic lupus erythematosus (SLE) and antineutrophil cytoplasmic antibody-associated vasculitis that provide insight into disease pathogenesis and identify biomarkers.

Methods: 44 vasculitis patients, 13 SLE patients and 25 age and sex-matched controls were enrolled. CD4 and CD8 T cells, B cells, monocytes and neutrophils were isolated from each patient and, together with unseparated peripheral blood mononuclear cells (PBMC), were hybridised to spotted oligonucleotide microarrays.

Results: Using expression data obtained from purified cells a substantial number of differentially expressed genes were identified that were not detectable in the analysis of PBMC. Analysis of purified T cells identified a SLE-associated, CD4 T-cell signature consistent with type 1 interferon signalling driving the generation and survival of tissue homing T cells and thereby contributing to disease pathogenesis. Moreover, hierarchical clustering using expression data from purified monocytes provided significantly improved discrimination between the patient groups than that obtained using PBMC data, presumably because the differentially expressed genes reflect genuine differences in processes underlying disease pathogenesis.

Conclusion: Analysis of leucocyte subsets enabled the identification of gene signatures of both pathogenic relevance and with better disease discrimination than those identified in PBMC. This approach thus provides substantial advantages in the search for diagnostic and prognostic biomarkers in autoimmune disease.


Conflict of interest statement

Competing interests: None.

Figures

Figure 1
Figure 1
Differences in cellular composition largely drive gene expression signatures seen in comparisons of peripheral blood mononuclear cell (PBMC) samples. (A) Hierarchical clustering of PBMC samples from antineutrophil cytoplasmic antibody-associated small-vessel vasculitis (AAV) and systemic lupus erythematosus (SLE) patients and controls broadly separates the samples into three groups. The numbers below the heat map show the distribution of AAV, SLE and control samples between the three groups. Vertical bars identify the following gene signatures; interferon, plasmablast and granulopoiesis (blue), CD8 T cell (purple), lymphoid (orange) and myeloid (yellow). (B–E) Gene set enrichment analysis was performed to look for enrichment of the interferon and granulopoiesis signatures described by Bennett et al. (B) Interferon-inducible genes are significantly enriched in SLE patients. (C and D) Granulopoiesis-associated genes are significantly enriched in both (C) SLE and (D) AAV patients and (E) interferon-inducible genes are not enriched in AAV patients. (F) Serum IgG but not IgM levels correlate with the presence of the plasmablast signature. PB sig +ve and –ve indicates patients with or without the plasmablast signature, respectively. (G) The plasmablast signature is associated with increased disease activity at enrolment. Horizontal bars denote the mean, statistical significance was determined using a t test. (H) AAV and SLE patients have reduced CD4 T-cell and increased CD14 monocyte levels and in addition, AAV patients have significantly reduced CD8 T-cell levels compared with controls. Horizontal bars denote the mean, statistical significance was determined using analysis of variance followed by post hoc testing, *p<0.05, **p<0.01, ***p<0.001. (I) CD8A messenger RNA levels correlate with the relative abundance of CD8 T cells in the PBMC samples arrayed.
Figure 2
Figure 2
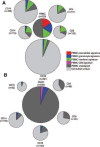
Expression profiling purified cells identify large numbers of novel expression differences. (A,B) Differential gene expression was measured in purified cell subsets from both (A) systemic lupus erythematosus (SLE) and (B) antineutrophil cytoplasmic antibody-associated small-vessel vasculitis (AAV) patients. Pie charts represent individual cell types and their size is proportional to the number of differentially expressed genes observed in each. Differentially expressed genes were defined as expression differences greater than 1.5-fold found to be statistically significant following correction for multiple testing by setting the false discovery rate to 5%.
Figure 3
Figure 3
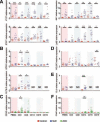
A gene signature consistent with T-cell activation is found in CD4 samples from systemic lupus erythematosus (SLE), but not antineutrophil cytoplasmic antibody-associated small-vessel vasculitis (AAV), patients. (A) Analysis of the differentially expressed genes in CD4 samples from SLE, but not AAV, patients (supplementary table 8, available online only) using Pathway Miner (www.biorag.org) revealed a gene association network consistent with T-cell activation. Nodes represent differentially expressed genes, orange and green nodes indicate upregulated and downregulated genes, respectively, in SLE patients compared with controls. Edges indicate annotated associations between genes, with the thickness of the edge indicating the number of annotated associations. (B) Gene set enrichment analysis found no evidence for this network in peripheral blood mononuclear cell (PBMC) samples from SLE patients. (C) Microarray-based expression levels of LAT and STAT1 are highly correlated. (D) BNIP3L and CFLAR, but not BCL2 or BCL2L1, are differentially expressed in CD4 samples from SLE patients compared with controls. Horizontal bars denote means, statistical significance was determined using a t test.
Figure 4
Figure 4
Monocyte gene expression data clearly differentiates patients with systemic lupus erythematosus (SLE) and antineutrophil cytoplasmic antibody-associated small-vessel vasculitis (AAV) from each other and from normal controls. Hierarchical clustering of 13 SLE patients, 44 AAV patients and 25 normal controls using data from genes expressed in CD14 monocytes separates the samples into the three diagnostic groups (compared with Figure 1A). Hierarchical clustering was performed using the Pearson correlation coefficient as distance metric and average-linkage clustering. The vertical blue bar denotes interferon-inducible genes.

References

    1. Golub TR, Slonim DK, Tamayo P, et al. Molecular classification of cancer: class discovery and class prediction by gene expression monitoring. Science 1999;286:531–7 - PubMed
    1. Alizadeh AA, Eisen MB, Davis RE, et al. Distinct types of diffuse large B-cell lymphoma identified by gene expression profiling. Nature 2000;403:503–11 - PubMed
    1. van't Veer LJ, Dai H, van de Vijver MJ, et al. Gene expression profiling predicts clinical outcome of breast cancer. Nature 2002;415:530–6 - PubMed
    1. Wang Y, Klijn JG, Zhang Y, et al. Gene-expression profiles to predict distant metastasis of lymph-node-negative primary breast cancer. Lancet 2005;365:671–9 - PubMed
    1. Lossos IS. Molecular pathogenesis of diffuse large B-cell lymphoma. J Clin Oncol 2005;23:6351–7 - PubMed

Publication types

MeSH terms