. 2009 Oct 20;106(42):17650-4.
doi: 10.1073/pnas.0910125106. Epub 2009 Oct 7.

Formation of nanoparticles of blue haze enhanced by anthropogenic pollution

Affiliations

Formation of nanoparticles of blue haze enhanced by anthropogenic pollution

Renyi Zhang et al. Proc Natl Acad Sci U S A. .

Abstract

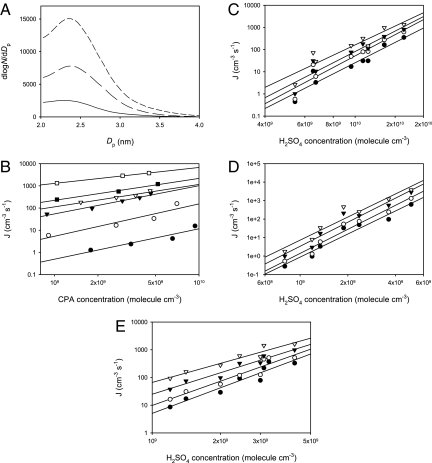
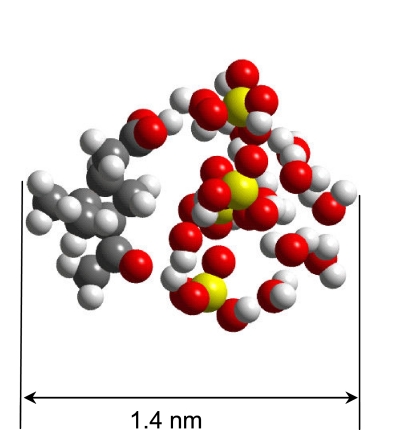
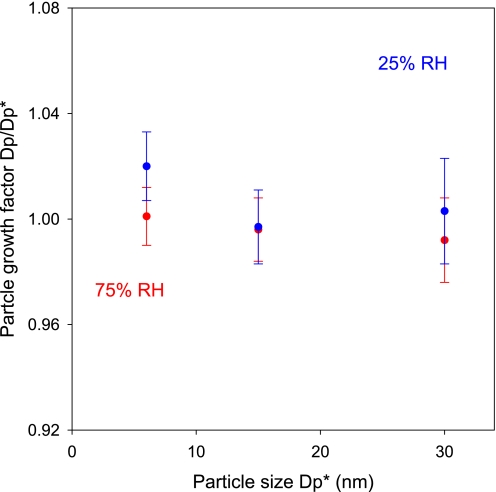
The molecular processes leading to formation of nanoparticles of blue haze over forested areas are highly complex and not fully understood. We show that the interaction between biogenic organic acids and sulfuric acid enhances nucleation and initial growth of those nanoparticles. With one cis-pinonic acid and three to five sulfuric acid molecules in the critical nucleus, the hydrophobic organic acid part enhances the stability and growth on the hydrophilic sulfuric acid counterpart. Dimers or heterodimers of biogenic organic acids alone are unfavorable for new particle formation and growth because of their hydrophobicity. Condensation of low-volatility organic acids is hindered on nano-sized particles, whereas ammonia contributes negligibly to particle growth in the size range of 3-30 nm. The results suggest that initial growth from the critical nucleus to the detectable size of 2-3 nm most likely occurs by condensation of sulfuric acid and water, implying that anthropogenic sulfur emissions (mainly from power plants) strongly influence formation of terrestrial biogenic particles and exert larger direct and indirect climate forcing than previously recognized.


Conflict of interest statement

The authors declare no conflict of interest.

Figures

Fig. 1.
Fig. 1.
New particle formation in the presence of CPA, H2SO4, and H2O. (A) Size distribution of newly nucleated particles. The concentration of H2SO4 was ≈3 × 10⁹ molecule cm−3, and the relative humidity (RH) was at 20%. The concentration of CPA was 7.2 × 10⁹ molecule cm−3 for top curve (short dashed line), 4.9 × 10⁹ molecule cm−3 for middle curve (long-dashed line), and zero for bottom curve (solid line). (B) Nucleation rate (J) as a function of CPA concentrations at 13% RH. For the lines from top to bottom, the H2SO4 concentration varied from 5 × 10⁹ (open squares), 3.6 × 10⁹ (solid squares), 2.4 × 10⁹ (open triangles), 1.9 × 10⁹ (solid triangles), 1.3 × 10⁹ (open circles) to 0.8 × 10⁹ molecule cm−3 (solid circles). (C–E) Nucleation rate as a function of the H2SO4 concentration at RH of 6% (C), 13% (D), and 20% (E). For the lines from top to bottom in C, the CPA concentration varied from 2.1 × 10⁹ (open triangles), 1.1 × 10⁹ (solid triangles), and 5.4 × 10⁸ molecule cm−3 (open circles) to zero (solid circles). For the lines from top to bottom in D, the CPA concentration varied from 6.1 × 10⁹ (open triangles), 4.0 × 10⁹ (solid triangles), and 1.4 × 10⁹ molecule cm−3 (open circles) to zero (solid circles). For the lines from top to bottom in E, the CPA concentration varied from 7.1 × 10⁹ (open triangles), 4.9 × 10⁹ (solid triangles), and 1.7 × 10⁹ molecule cm−3 (open circles) to zero (solid circles). All experiments were performed at 284 ± 2 K and a total pressure of 760 Torr.
Fig. 2.
Fig. 2.
Molecular dynamic simulation of a critical nucleus consisting of one CPA, four sulfuric acid, and 10 water molecules. Carbon, sulfur, oxygen, and hydrogen atoms are represented by black, yellow, red, and gray spheres, respectively. The organic acid portion (Left) is connected to the cluster via the carboxylic functional group.
Fig. 3.
Fig. 3.
TD-ID-CIMS composition analysis of nano-sized particles formed from the ternary nucleation of the H2SO4-CPA-H2O system. Ion signals for HSO4, HSO4·H2SO4, CPA·O2, and HSO4·CPA, representing H2SO4, H2SO4-H2SO4 dimer, CPA, and CPA-H2SO4 dimer, respectively. The reagent ions were CO3 (60 amu) and CO4 (76 amu). The collected particle mass was heated at ≈2 min. To ensure a sufficient mass was collected, the particle size ranged from 3 to 13 nm, with a peak diameter of ≈7 nm and a peak concentration (dN/dDp) of 107. The ratio between CPA and H2SO4 was estimated to be ≈1 to1,000 in the collected particle mass. In our experiments, it took ≈4 h to collect a ≈150 ng particle mass, assuming a 10% overall charging efficiency and a particle density of 1.5 g cm−3.
Fig. 4.
Fig. 4.
Growth factor (Dp/Dp*) of particles on exposure to ammonia under different RH conditions, where Dp* denotes the initial particle size selected by the first nano-DMA, and Dp represents the particle size measured by the second nano-DMA after exposure. The exposure time was ≈30 s. The gaseous concentration of ammonia was 3 × 10¹⁴ molecule cm−3. The experiments were performed at 2 RH conditions, i.e., 25% (blue) and 75% (red), 298 ± 2 K, and 760 Torr. The vertical bars represented the random error of the measurements (2 σ), and the values were averaged over at least three measurements.

References

    1. Guenther A, et al. A global-model of natural volatile organic-compound emissions. J Geophys Res. 1995;100:8873–8892.
    1. Went FW. Blue hazes in the atmosphere. Nature. 1960;187:641–643.
    1. Finlayson-Pitts BJ, Pitts JN., Jr . Chemistry of the Upper and Lower Atmosphere: Theory, Experiments, and Applications. San Diego, CA: Academic; 2000.
    1. Zhao J, Zhang R. Theoretical investigation of atmospheric oxidation of biogenic hydrocarbons: A critical review. Adv Quantum Chem. 2008;55:177–213.
    1. Novakov T, Penner JE. Large contribution of organic aerosols to cloud-condensation-nuclei concentrations. Nature. 1993;365:823–826.

Publication types

LinkOut - more resources