. 2009 Oct 13;106(41):17552-7.
doi: 10.1073/pnas.0905502106. Epub 2009 Oct 6.

Ubiquitin-dependent lysosomal targeting of GABA(A) receptors regulates neuronal inhibition

Affiliations

Ubiquitin-dependent lysosomal targeting of GABA(A) receptors regulates neuronal inhibition

I Lorena Arancibia-Cárcamo et al. Proc Natl Acad Sci U S A. .

Abstract

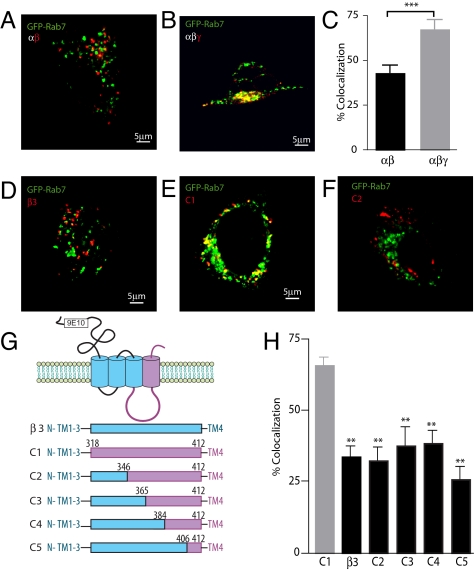
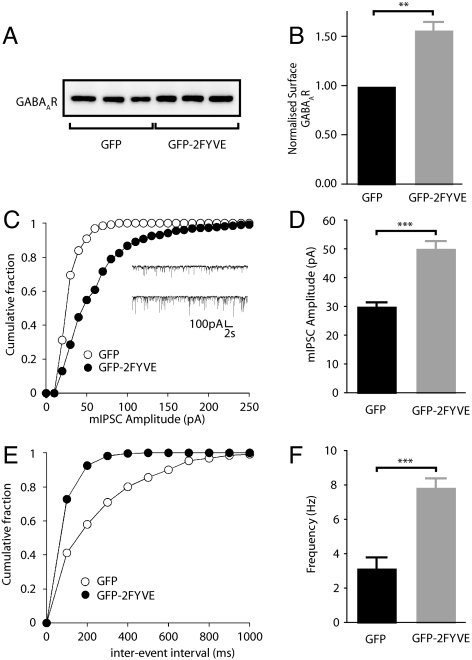
The strength of synaptic inhibition depends partly on the number of GABA(A) receptors (GABA(A)Rs) found at synaptic sites. The trafficking of GABA(A)Rs within the endocytic pathway is a key determinant of surface GABA(A)R number and is altered in neuropathologies, such as cerebral ischemia. However, the molecular mechanisms and signaling pathways that regulate this trafficking are poorly understood. Here, we report the subunit specific lysosomal targeting of synaptic GABA(A)Rs. We demonstrate that the targeting of synaptic GABA(A)Rs into the degradation pathway is facilitated by ubiquitination of a motif within the intracellular domain of the gamma2 subunit. Blockade of lysosomal activity or disruption of the trafficking of ubiquitinated cargo to lysosomes specifically increases the efficacy of synaptic inhibition without altering excitatory currents. Moreover, mutation of the ubiquitination site within the gamma2 subunit retards the lysosomal targeting of GABA(A)Rs and is sufficient to block the loss of synaptic GABA(A)Rs after anoxic insult. Together, our results establish a previously unknown mechanism for influencing inhibitory transmission under normal and pathological conditions.


Conflict of interest statement

The authors declare no conflict of interest.

Figures

Fig. 1.
Fig. 1.
Functional effects of disrupting lysosomal degradation (A–E) GABAAR cluster analysis on control and leupeptin treated cortical slices. High resolution confocal images were taken of 25-μm sections across the cells bodies (identified by DAPI nuclear staining, blue). (A and B) Pseudocolor images of GABAAR clusters. Clusters can be identified by changes in intensity (blue to pink to white) over a central point. (A' and B') Merged images show GABAAR clusters (green) apposed to presynaptic VIAAT positive terminals (red). (C) Cumulative plot showing the cluster size distributions under control and leupeptin treated conditions. (D) Average GABAAR cluster size in control and leupeptin treated cells. (E) Average number of GABAAR clusters in control and leupeptin treated cells (n = 11–12 cells; ***, P < 0.001). (F) Summary data plot of the effect of leupeptin on eIPSC density (n = 12, P < 0.001 unpaired t test). (G) Representative cumulative plots and traces (Inset) of mIPSC amplitude for representative cells from cortical slices under control and leupeptin treated conditions. (H) Bar plot summary showing the effect of leupeptin on mIPSC amplitude (n = 7, ***, P < 0.001). (I) Bar plot summary showing the effect of leupeptin on mIPSC frequency (n = 7, ***, P < 0.001). (J) Representative cumulative plots of mIPSC inter-event interval of representative cells under control and leupeptin treated conditions.
Fig. 2.
Fig. 2.
γ2 subunit dependent lysosomal targeting of GABAARs. (A and B) Representative images of internalized GABAARs (red) comprised of α1β3 (A) or α1β3γ2 (B) in HEK293 cells coexpressed with the late endosomal/lysosomal marker GFP-Rab7 (green). Areas of overlap are seen in yellow. (C) Summary data of the colocalization levels between internalized GABAARs and GFP-Rab7 (n = 14–16, ***, P < 0.001). (D–F) Representative images of internalized β3 subunits or β3-γ2 chimeras C1–C2 (red) in HEK293 cells coexpressed with the late endosomal/lysosomal marker GFP-Rab7 (green). Areas of overlap are seen in yellow. (G) Schematic diagram of β3-γ2 chimeras C1–C5. (H) Summary data of the percent colocalization levels of internalized C1–C5 and GFP-Rab7 (n = 8–12, **, P < 0.01).
Fig. 3.
Fig. 3.
Functional effects of expressing GFP-2FYVE. (A) Cell surface biotinylations of cortical cells expressing GFP or GFP-2FYVE. (B) Bar plot summary showing GABAAR surface levels in cells expressing GFP or GFP-2FYVE. Levels are represented as percentage-normalized to those observed in GFP control (n = 11 independent experiments, ***, P < 0.001 paired t test). (C) Representative cumulative plots and traces (Inset) of mIPSC amplitude of representative cells expressing GFP (open circles) or GFP-2FYVE (closed circles). (D) Bar plot summary showing the effect of GFP-2FYVE expression on mIPSC amplitude (n = 8–9, ***, P < 0.001). (E) Representative cumulative plots of mIPSC inter-event interval of representative cells expressing GFP (open circles) or GFP-2FYVE (closed circles). (F) Bar plot summary showing the effect of GFP-2FYVE expression on mIPSC frequency (n = 8–9, ***, P < 0.001).
Fig. 4.
Fig. 4.
GABAAR ubiquitination is required for late endosomal/lysosomal targeting. (A and B) Representative images of internalized α1β3γ2 (A) or α1β3γ2K7R (B) in HEK293 cells coexpressing the late endosomal/lysosomal marker GFP-Rab7. (C) Summary data of the colocalization levels of internalized GABAARs and GFP-Rab7. (D) The γ2K7R subunit mutant shows decreased levels of ubiquitination compared with the wild-type γ2 GABAAR subunit. (E and F) Typical traces of evoked GABAergic currents in HEK-293 cells expressing receptors composed of α1β3γ2 or α1β3γ2K7R clamped at −70 mV and treated with 20 μM Leupeptin. (G) The magnitude of IGABA measured at 5-min intervals was then normalized to that evident at time 0 (5 min after break-in) for cells expressing α1β3γ2 or α1β3γ2K7R receptors under control conditions and leupeptin treatment (n = 7–11 cells).
Fig. 5.
Fig. 5.
Oxygen glucose deprivation results in a ubiquitination dependent decrease in GABAAR surface levels. (A and B) 25-μm dendritic segment of 12–16 DIV hippocampal cells expressing GFP-tagged γ2 (A) and γ2K7R (B) imaged over time under OGD conditions. Arrowheads point to GFP clusters. (Scale bar: 5 μm.) (C) GFP cluster fluorescence was monitored over time and normalized to t = −10 min. (D) Summary data plot of normalized cluster fluorescence (F/F−10) at t = 30 min for cells expressing GFPγ2 and GFPγ2K7R (n = 7–8, ***, P < 0.001).

References

    1. Jacob TC, Moss SJ, Jurd R. GABA(A) receptor trafficking and its role in the dynamic modulation of neuronal inhibition. Nat Rev Neurosci. 2008;9:331–343. - PMC - PubMed
    1. Nusser Z, Cull-Candy S, Farrant M. Differences in synaptic GABA(A) receptor number underlie variation in GABA mini amplitude. Neuron. 1997;19:697–709. - PubMed
    1. Arancibia-Carcamo IL, Kittler JT. Regulation of GABA(A) receptor membrane trafficking and synaptic localization. Pharmacol Ther. 2009;123:17–31. - PubMed
    1. Mielke JG, Wang YT. Insulin exerts neuroprotection by counteracting the decrease in cell-surface GABA receptors after oxygen-glucose deprivation in cultured cortical neurons. J Neurochem. 2005;92:103–113. - PubMed
    1. Kang JQ, Shen W, Macdonald RL. Why does fever trigger febrile seizures? GABAA receptor gamma2 subunit mutations associated with idiopathic generalized epilepsies have temperature-dependent trafficking deficiencies. J Neurosci. 2006;26:2590–2597. - PMC - PubMed

Publication types

LinkOut - more resources