. 2009 Dec 4;284(49):33841-9.
doi: 10.1074/jbc.M109.048280. Epub 2009 Oct 8.

Anionic lipids allosterically modulate multiple nicotinic acetylcholine receptor conformational equilibria

Affiliations

Anionic lipids allosterically modulate multiple nicotinic acetylcholine receptor conformational equilibria

Corrie J B daCosta et al. J Biol Chem. .

Abstract

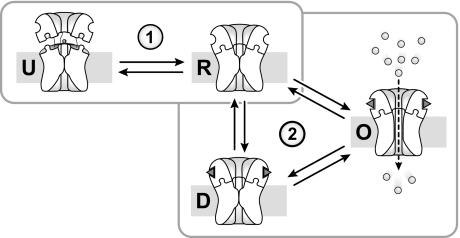
Anionic lipids influence the ability of the nicotinic acetylcholine receptor to gate open in response to neurotransmitter binding, but the underlying mechanisms are poorly understood. We show here that anionic lipids with relatively small headgroups, and thus the greatest ability to influence lipid packing/bilayer physical properties, are the most effective at stabilizing an agonist-activatable receptor. The differing abilities of anionic lipids to stabilize an activatable receptor stem from differing abilities to preferentially favor resting over both uncoupled and desensitized conformations. Anionic lipids thus modulate multiple acetylcholine receptor conformational equilibria. Our data suggest that both lipids and membrane physical properties act as classic allosteric modulators influencing function by interacting with and thus preferentially stabilizing different native acetylcholine receptor conformational states.


Figures

FIGURE 1.
FIGURE 1.
Chemical structures of anionic phospholipids. A, phospholipid molecules studied here contain palmitoyl (R1) and oleoyl (R2) acyl chains attached to a phosphoglycerol backbone. The headgroup (X) connects to the phosphate moiety. For PI, both R1 and R2 are oleoyl chains. B, structures of various headgroups (X). Cardiolipin (Card) is composed of two phospholipid moieties (Y in A) linked through a single glycerol moiety.
FIGURE 2.
FIGURE 2.
Ability of the nAChR to undergo agonist-induced allosteric transitions is correlated with reduced nAChR solvent accessibility. Solvent accessibility was assessed from the extent of nAChR peptide hydrogen/deuterium exchange in each membrane environment (white bars), as measured from the residual amide II band in spectra recorded after 72 h in 2H2O at 4 °C (supplemental Figs. S1 and S2). The relative abilities of the nAChR to undergo agonist-induced resting-to-desensitized transitions was determined from the relative intensities of the conformationally sensitive difference band centered at 1655 cm−1 (gray bars) observed in Carb difference spectra recorded from each reconstituted membrane (Fig. 3). Both nAChR activity/function and the extent of unexchanged hydrogens were normalized to the values obtained with PC-nAChR (0) and PC/PA/Chol-nAChR (1.0). For PC-nAChR, ∼20% of the peptide hydrogens are resistant to exchange after 72 h in 2H2O at 4 °C. For the PC/PA/Chol-nAChR, ∼40% of the peptide hydrogens are resistant to peptide hydrogen/deuterium exchange. The error bars for the extent of hydrogen/deuterium exchange are the mean ± S.E. for n = 2–5 measurements.
FIGURE 3.
FIGURE 3.
Anionic lipids influence the ability of the nAChR to undergo Carb-induced structural transitions from the resting to the desensitized state. Infrared difference spectra were recorded from the nAChR in the following: trace i, 3:1:1 PC/PA/Chol; trace ii, 3:2 PC/PA; trace iii, 3:2 PC/PG; trace iv, 3:2 PC/PI; trace v, 3:1 PC/cardiolipin; trace vi, 3:2 PC/PS; and trace vii, PC membranes. The vibration near 1724 cm−1 is due to nAChR-bound Carb. Vibrations near 1620 and 1515 cm−1 reflect the formation of Carb-aromatic residue interactions in the binding site. The amide I (1655 cm−1) and II (1545 cm−1) vibrations reflect changes in the polypeptide backbone upon Carb-induced conformational change (shaded). Increasing intensity of the amide I and II difference bands correlates with an increasing proportion of nAChRs stabilized in a coupled resting conformation that undergoes desensitization. Traces i, ii, vi, and vii are from Refs. , .
FIGURE 4.
FIGURE 4.
Anionic lipids influence conformational transitions involving the nAChR pore. Conformational transitions of the nAChR pore were probed by monitoring the fluorescence of dibucaine-displaceable ethidium binding. The fluorescence emission of ethidium at 590 nm was monitored in the presence of the nAChR reconstituted into the following: trace i, 3:2 PC/PA; trace ii, 3:2 PC/PG; trace iii, 3:2 PC/PI; trace iv, 3:2 PC/PS; and trace v, PC membranes, using 20 nm excitation and emission slit widths. A, at the indicated times, ∼50 nm nAChR, 500 μm Carb, and 500 μm dibucaine were added to a 0.3 μm ethidium solution. The light gray fluorescence traces were recorded using nAChR preincubated with a large excess of α-bungarotoxin (α-Btx; final concentration = 1.0 μm). The fluorescence traces in the presence and absence of α-bungarotoxin are offset slightly to improve clarity. The sharp spikes in each fluorescence emission trace reflect the scattering of light upon insertion of the pipette into the cuvette. EthBr, ethidium bromide; Dib, dibucaine. B, dibucaine-displaceable ethidium fluorescence emission intensity at 590 nm in the presence (+) or absence (−) of Carb. Error bars are the mean ± S.E. for n = 6 experiments, three measurements each from two different reconstitutions at the indicated lipid composition. a.u., absorbance units. C, schematic for the ethidium (Eth) fluorescence measurements. Ethidium fluoresces weakly in solution (left and right) but with greater intensity when bound to the desensitized nAChR pore (middle).
FIGURE 5.
FIGURE 5.
Agonist-activatable PC/PA-nAChR undergoes a rapid transient Carb-induced transition leading to increased accessibility to the ion channel pore. The fluorescence emission of ethidium at 590 nm was monitored with PC/PA-nAChR, using 20 nm excitation and emission slit widths. Trace i, at the indicated times, ∼50 nm nAChR, 500 μm Carb, and 500 μm dibucaine (Dib) were added to a 0.3 μm ethidium solution. Trace ii, nAChR was preincubated with 500 μm Carb for 30 min. At the indicated time, ∼50 nm nAChR + Carb were added to a 0.3 μm ethidium solution. Trace iii, at the indicated time, ∼50 nm nAChR was added to a solution containing both 0.3 μm ethidium and 500 μm Carb. EthBr, ethidium bromide; a.u., absorbance units.
FIGURE 6.
FIGURE 6.
Ethidium binding to the nAChR provides a measure of the relative proportions of resting, desensitized, and uncoupled conformations. The fluorescence emission of ethidium at 590 nm was monitored in the presence of the nAChR reconstituted into the following: trace i, 3:2 PC/PA; trace ii, 3:2 PC/PG; trace iii, 3:2 PC/PI; trace iv, 3:2 PC/PS; and trace v, PC membranes. At the indicated times, ∼50 nm nAChR, 500 μm Carb, and two times 500 μm dibucaine (Dib) were added to ethidium at either 1× KD (0.3 μm; lowest trace), 10× KD (3.0 μm; middle trace), or 100× KD (30 μm; top trace). The fluorescence traces are offset and shaded to improve clarity. Inset, dibucaine-displaceable ethidium fluorescence emission intensity at 590 nm in the presence (+) or absence (−) of Carb. Error bars are the mean ± S.E. for n = 6 experiments; three measurements are each from two different reconstitutions at the indicated lipid compositions except for trace iii, which is n = 3 from one reconstitution. These traces were recorded with 5 nm excitation and 20 nm emission slit widths to allow comparison of the fluorescence intensities at all three ethidium concentrations. A 530 nm excitation wavelength maximizes the fluorescence intensity arising from nAChR-bound versus solution ethidium (see under “Experimental Procedures”). EthBr, ethidium bromide; a.u., absorbance units.
FIGURE 7.
FIGURE 7.
Conformational scheme for the nAChR in reconstituted membranes. The effects of lipids on nAChR function have been interpreted previously using a conformational scheme involving resting (R), open (O), and desensitized (D) conformations (scheme 2). The nAChR in reconstituted membranes can be stabilized in an uncoupled conformation (14). Lipid effects on nAChR function in reconstituted membranes must therefore include equilibria between uncoupled (U) and coupled (R, O, and D) states (scheme 1).

References

    1. Sine S. M., Engel A. G. (2006) Nature 440, 448–455 - PubMed
    1. Shen X. M., Deymeer F., Sine S. M., Engel A. G. (2006) Ann. Neurol. 60, 128–136 - PubMed
    1. Engel A. G., Ohno K., Sine S. M. (2002) Mol. Neurobiol. 26, 347–367 - PubMed
    1. Barrantes F. J. (2004) Brain Res. Brain Res. Rev. 47, 71–95 - PubMed
    1. Criado M., Eibl H., Barrantes F. J. (1984) J. Biol. Chem. 259, 9188–9198 - PubMed

Publication types

LinkOut - more resources