

Infants born preterm exhibit different patterns of center-of-pressure movement than infants born at full term
- PMID: 19815647
- PMCID: PMC2794478
- DOI: 10.2522/ptj.20080361
Infants born preterm exhibit different patterns of center-of-pressure movement than infants born at full term
Abstract
Background: Infants born preterm are at risk for developmental impairments related to postural control.
Objective: The purpose of this study was to determine whether infants born preterm and infants born at full term differed in postural control at 1 to 3 weeks after term age.
Design: This study included 17 infants born preterm (mean gestational age=31.9 weeks, range=25.0-34.6) and 15 infants born at full term (mean gestational age=38.9 weeks, range=37.3-40.6). All infants were without diagnosed neurological or genetic conditions.
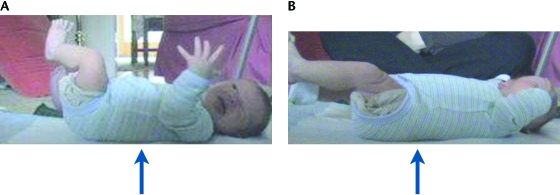
Measurement: Center-of-pressure (COP) data were recorded at 5 Hz while each infant was positioned supine on a pressure-sensitive mat in an alert behavioral state. Root mean square (RMS) displacement and approximate entropy (ApEn) were used to describe the COP movement variability in the time series. Differences between groups were identified using independent t tests.
Results: The COP time series were found to be deterministic, suggesting order in the time series. Infants born preterm exhibited significantly larger RMS values in the caudal-cephalic direction than infants born at full term (1.11 and 0.83 cm, respectively; t=-2.6, df=30, P=.01). However, infants born at full term had significantly larger ApEn values in the caudal-cephalic direction (1.19 and 1.11, respectively; t=2.4, df=30, P=.02). The 2 groups did not differ in RMS or ApEn values in the medial-lateral direction or the resultant.
Conclusions: Infants born at full term exhibited COP displacements in the caudal-cephalic direction that were smaller in amplitude, but may be considered more complex or less predictable, than those of infants born preterm. One explanation is that infants born preterm exhibited more stereotypic patterns of movement, resulting in large, but repetitive, COP excursions. A combination of linear and nonlinear measures may provide insight into the control of posture of young infants.
Figures


References
-
- Robertson SS. Oscillation and complexity in early infant behavior. Child Dev 1993;64:1022–1035 - PubMed
-
- Einspieler C, Prechtl HFR, Bos AF, et al. Prechtl's Method on the Qualitative Assessment of General Movements in Preterm, Term, and Young Infants London, United Kingdom: MacKeith Press; ; 2004:91 Clinics in Developmental Medicine Series, No. 167
-
- Brazelton TB. Neonatal Behavioral Assessment Scale London, United Kingdom: MacKeith Press; ; 1995
-
- Groen SE, de Blecourt AC, Postema K, Hadders-Algra M. General movements in early infancy predict neuromotor development at 9 to 12 years of age. Dev Med Child Neurol 2005;47:731–738 - PubMed
Publication types
MeSH terms
Grants and funding
LinkOut - more resources
Full Text Sources
Medical
Research Materials
Miscellaneous
