. 2009 Dec;37(22):e148.
doi: 10.1093/nar/gkp811.

A simple method for directional transcriptome sequencing using Illumina technology

Affiliations

A simple method for directional transcriptome sequencing using Illumina technology

Nicholas J Croucher et al. Nucleic Acids Res. 2009 Dec.

Abstract

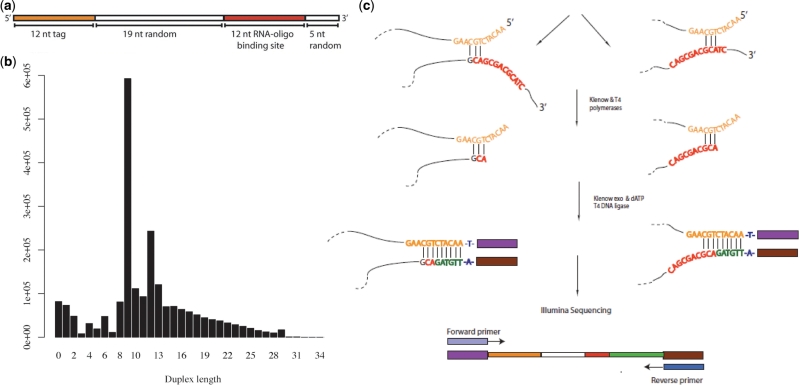
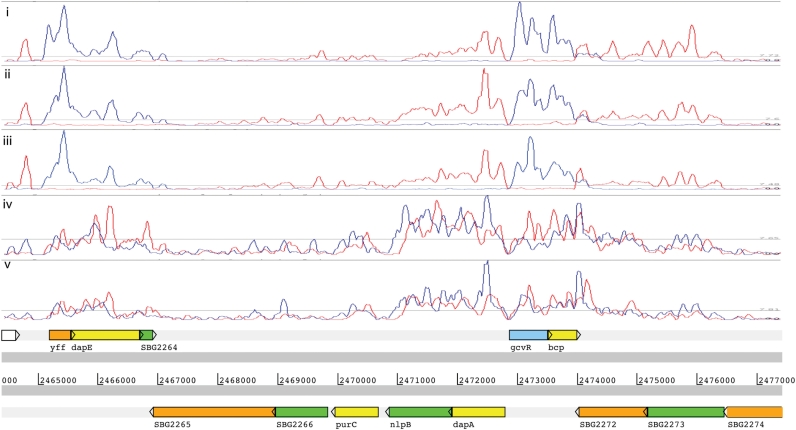
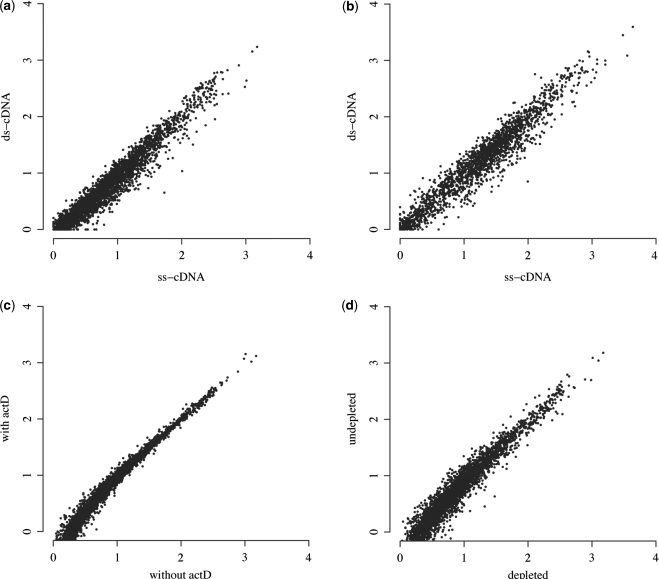
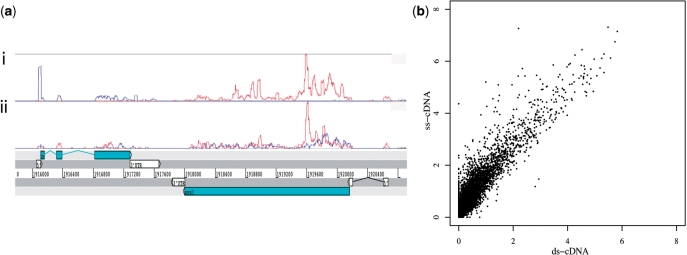
High-throughput sequencing of cDNA has been used to study eukaryotic transcription on a genome-wide scale to single base pair resolution. In order to compensate for the high ribonuclease activity in bacterial cells, we have devised an equivalent technique optimized for studying complete prokaryotic transcriptomes that minimizes the manipulation of the RNA sample. This new approach uses Illumina technology to sequence single-stranded (ss) cDNA, generating information on both the direction and level of transcription throughout the genome. The protocol, and associated data analysis programs, are freely available from http://www.sanger.ac.uk/Projects/Pathogens/Transcriptome/. We have successfully applied this method to the bacterial pathogens Salmonella bongori and Streptococcus pneumoniae and the yeast Schizosaccharomyces pombe. This method enables experimental validation of genetic features predicted in silico and allows the easy identification of novel transcripts throughout the genome. We also show that there is a high correlation between the level of gene expression calculated from ss-cDNA and double-stranded-cDNA sequencing, indicting that ss-cDNA sequencing is both robust and appropriate for use in quantitative studies of transcription. Hence, this simple method should prove a useful tool in aiding genome annotation and gene expression studies in both prokaryotes and eukaryotes.


Figures

Figure 1.
Figure 1.
The hypotheses proposed to account for the attachment of Illumina adapted dimers to ss-cDNA: (a) attachment of adapters to ss-cDNA, and priming of second strand synthesis by (b) RNA fragments, (c) intermolecular cDNA annealing and (d) intramolecular cDNA annealing.
Figure 2.
Figure 2.
(a) Schematic representation of the DNA oligonucleotides from which Illumina libraries were generated. (b) Distribution of duplex lengths amongst a sequenced sample of single-stranded DNA oligonucleotides. We extracted reads corresponding to the oligonucleotide by searching the output data for the 12 nt known sequence tag. Duplex lengths were then calculated by counting the number of bases at the 3′-end found to be the reverse complement of those at the 5′-end. This revealed a smooth distribution of values over a range of sizes, with large peaks at 12 bp (likely resulting from intermolecular annealing) and 9 bp (probably the consequence of a 3 bp duplex that can form between the known sequence tag and RNA binding site). (c) Two proposed mechanisms for the formation of species with 9 nt of reverse complementarity between the 5′ and 3′-ends, the most common duplex length observed. The vast majority of these were found to have 3 bp ‘seed duplexes’ formed by base pairing between –CGT– in the sequence tag and either the –GCA– in the 3′ half of the RNA oligonucleotide binding site, or the CA-dinucleotide at the start of the binding site when the preceding nucleotide (the last of the 19 nt random sequence) was G.
Figure 3.
Figure 3.
RNA-seq data displayed in Artemis. Mapped RNA-seq data is displayed as a plot showing sequence depth for the forward (blue) and reverse strand (red). The S. bongori genome annotation is also shown. The graphs, from the top downwards, represent the result of sequencing (i) undepleted ss-cDNA (ii) depleted ss-cDNA (iii) depleted ss-cDNA with actD present in the reverse transcription reaction (iv) ds-cDNA and (v) ds-cDNA with actD present in the reverse transcription reaction.
Figure 4.
Figure 4.
Scatter plots showing the correlation between the genome-wide levels of CDS expression in RNA-seq datasets. Each data point represents the standardized mean fold coverage of a CDS, plotted as log (mean + 1). The top two plots show the correlation between the measured level of CDS expression between technical replicates sequencing ss-cDNA and ds-cDNA for (a) S. bongori and (b) S. pneumoniae. The bottom two plots show the impact of modifications to the methodolgy, when applied to S. bongori, on the resulting dataset. (c) shows that the addition of actD has little impact on the calculated level of transcription across the genome. Similarly, (d) shows that depletion of rRNA causes little alteration in the results obtained.
Figure 5.
Figure 5.
Application of ss-cDNA sequencing to the eukaryote S. pombe. (a) Sequence reads aligned to the genomic locus on chromosome I containing the cdc42 and pss1 genes. The mapped sequence read depth is displayed as in Figure 3, with graphs representing the result of sequencing (i) ss-cDNA and (ii) ds-cDNA. This shows that this technique is adept at delimiting intron–exon boundaries and detecting 5′ and 3′ untranslated regions (UTR; the UTR in the figure are annotated in the publicly available version of the S. pombe genome). (b) Scatter plot showing the correlation between the measured CDS expression levels obtained by sequencing ss- and ds-cDNA, displayed as in Figure 4.

References

    1. Graveley BR. Molecular biology: power sequencing. Nature. 2008;453:1197–1198. - PMC - PubMed
    1. Mortazavi A, Williams BA, McCue K, Schaeffer L, Wold B. Mapping and quantifying mammalian transcriptomes by RNA-Seq. Nat. Methods. 2008;5:621–628. - PubMed
    1. Sultan M, Schulz MH, Richard H, Magen A, Klingenhoff A, Scherf M, Seifert M, Borodina T, Soldatov A, Parkhomchuk D, et al. A global view of gene activity and alternative splicing by deep sequencing of the human transcriptome. Science. 2008;321:956–960. - PubMed
    1. Nagalakshmi U, Wang Z, Waern K, Shou C, Raha D, Gerstein M, Snyder M. The transcriptional landscape of the yeast genome defined by RNA sequencing. Science. 2008;320:1344–1349. - PMC - PubMed
    1. Wilhelm BT, Marguerat S, Watt S, Schubert F, Wood V, Goodhead I, Penkett CJ, Rogers J, Bahler J. Dynamic repertoire of a eukaryotic transcriptome surveyed at single-nucleotide resolution. Nature. 2008;453:1239–1243. - PubMed

Publication types

MeSH terms