. 2009 Nov;175(5):2226-34.
doi: 10.2353/ajpath.2009.090152. Epub 2009 Oct 8.

The stent-eluting drugs sirolimus and paclitaxel suppress healing of the endothelium by induction of autophagy

Affiliations

The stent-eluting drugs sirolimus and paclitaxel suppress healing of the endothelium by induction of autophagy

Shin-ichiro Hayashi et al. Am J Pathol. 2009 Nov.

Abstract

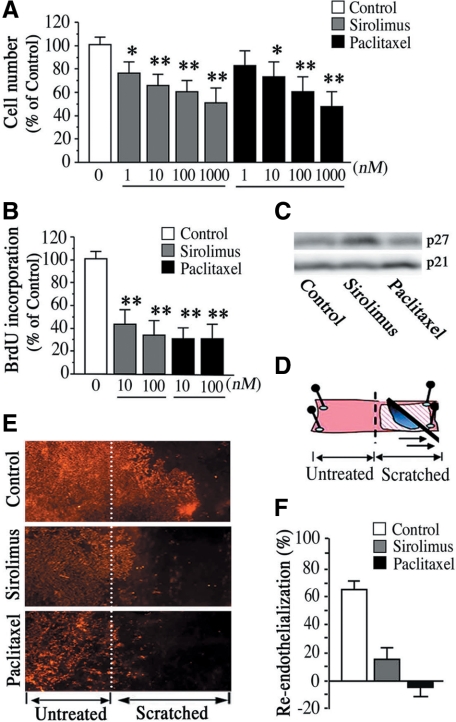
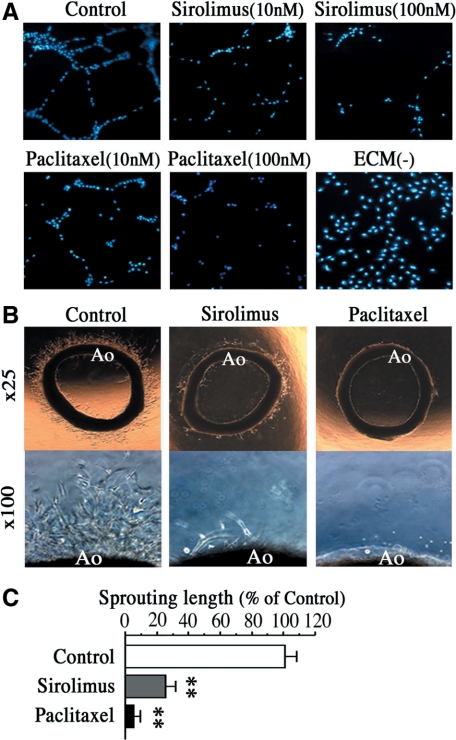
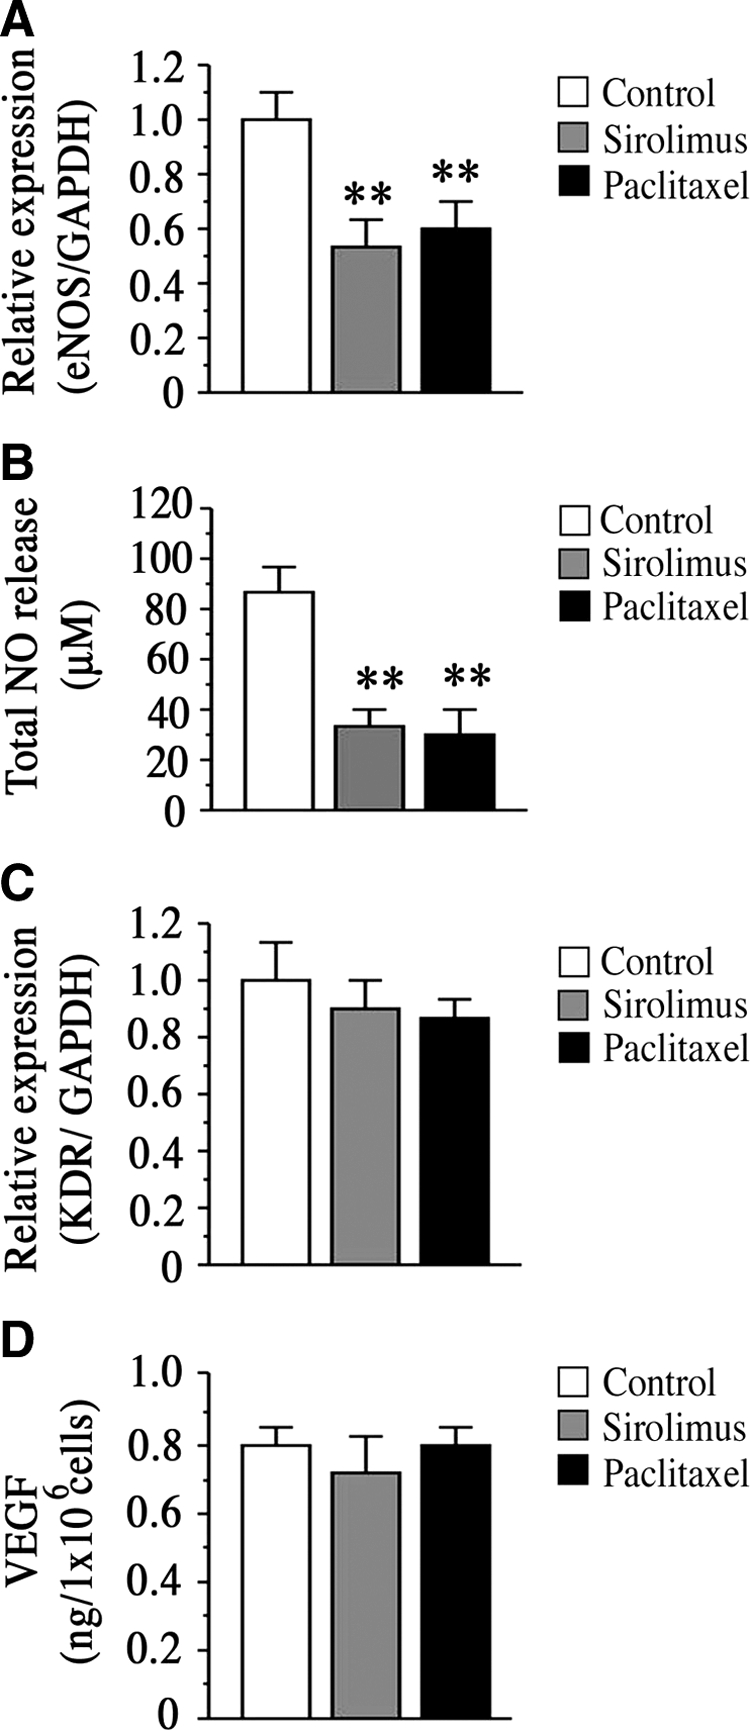
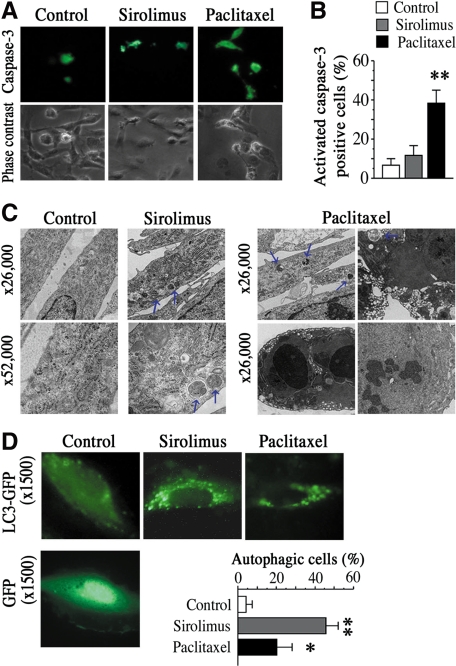
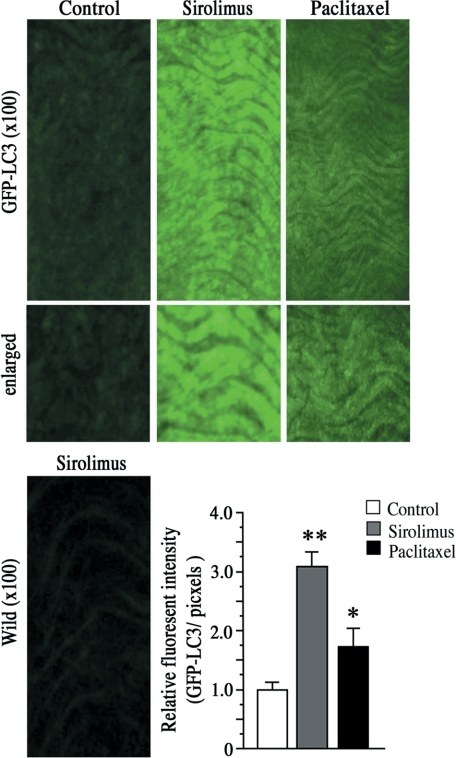
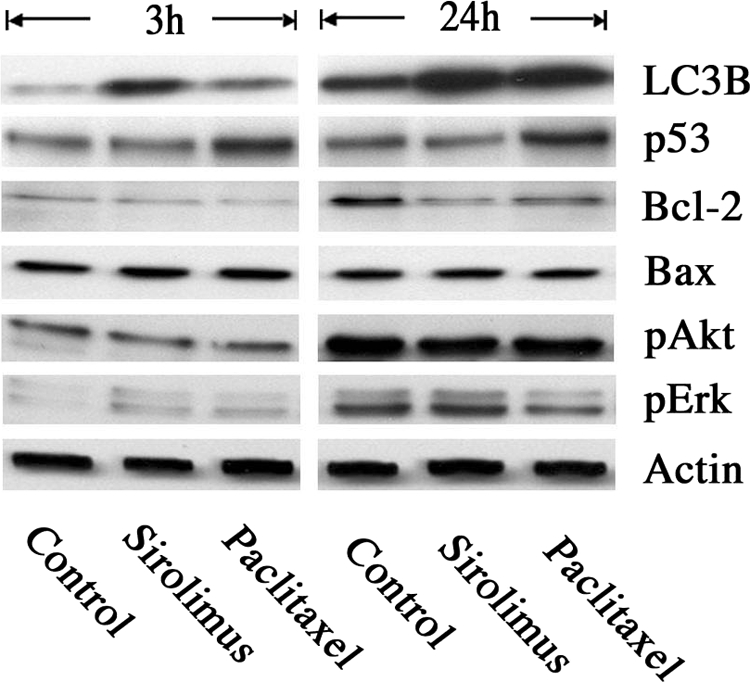
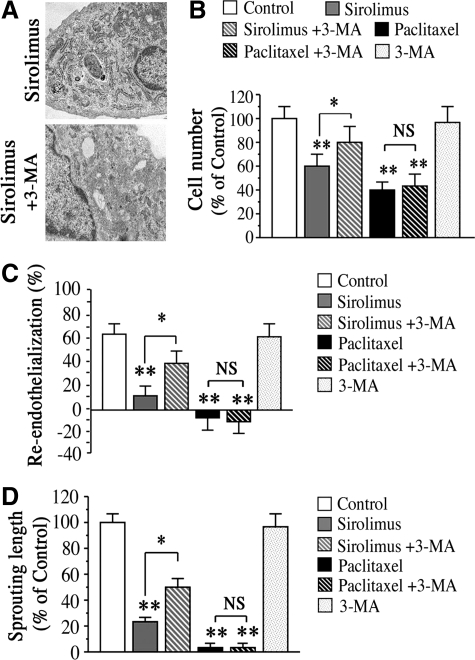
Clinical studies have indicated that the stent-eluting drugs sirolimus and paclitaxel impact restenosis; however, it is still elusive how these drugs affect the vascular endothelium at the molecular and cellular levels. The purpose of this study was to determine whether sirolimus and paclitaxel induce molecular and cellular alterations in the vascular endothelium. Endothelial regrowth was assessed in human aortic endothelial cells and rat aortic endothelium. Molecular and cellular alterations were analyzed in human aortic endothelial cells by Western blot analysis, transmission electron microscopy, and immunofluorescence staining. Green fluorescent protein-LC3 mice were used to analyze autophagic endothelium. Here, we show that sirolimus and paclitaxel differentially induce self-digesting autophagy in vascular endothelial cells with changes in expression of LC3B, p53, and Bcl-2, considerably suppressing re-endothelialization and revascularization. These results suggest that phenotypic alteration in the endothelium by sirolimus or paclitaxel might affect the rates of late stent thrombosis, myocardial infarction, and mortality.


Figures

Figure 1
Figure 1
Sirolimus and paclitaxel suppress the capacity of the endothelium for re-endothelialization. A: HAEC cell number after 48 hours of sirolimus or paclitaxel treatment. Values are expressed as mean ± SEM. n = 9 per group (HAECs with three different passages from three donors). *P < 0.05 and **P < 0.01 vs. control group without stimulation. B: 5-Bromo-2′-deoxyuridine incorporation assay for endothelial proliferation after 48 hours of sirolimus or paclitaxel treatment. C: Representative immunoblot images of p27Kip1 and p21Cip1 after 24 hours of sirolimus (10 nmol/L) or paclitaxel (10 nmol/L) treatment. n = 3 per group. D: Schematic indication of ex vivo re-endothelialization assay. A scratched wound was created on rat aortic endothelium on day 0. E and F: Effects of sirolimus and paclitaxel on re-endothelialization. Representative images of DiI-labeled acetylated low-density lipoprotein stained rat aortic endothelium 7 days after making a scratched wound in the sirolimus (10 nmol/L) group or paclitaxel (10 nmol/L) group (E) and quantification of % re-endothelialization on scratched area relative to unscratched vessels. n = 8 per group (F).
Figure 2
Figure 2
Sirolimus and paclitaxel suppress the capacity of the endothelium for arterial revascularization. A: Representative images of capillary tube formation of HAECs after 18 hours of treatment with sirolimus or paclitaxel (10 nmol/L or 100 nmol/L). n = 8 per group. Note that ECM (−) indicates the group without treatments of Matrigel and compounds. B: Representative images of vessel sprouting from rat aorta treated with sirolimus (10 nmol/L) or paclitaxel (10 nmol/L) for 3 days. Lower panels show high magnification views (×100) of vessel-sprouting lesions around rat aorta (Ao). C: Quantification of vessel-sprouting lengths from aortic rings after sirolimus or paclitaxel treatment. n = 8 per group. **P < 0.01 vs. control.
Figure 3
Figure 3
Effects of sirolimus and paclitaxel on expression of eNOS, KDR, and VEGF. A: Transcriptional expression of eNOS in HAECs after 12 hours of sirolimus (10 nmol/L) or paclitaxel (10 nmol/L) treatment. B: Graph indicates total NO release from HAECs after 24 hours of sirolimus (10 nmol/L) or paclitaxel (10 nmol/L) treatment. n = 8 per group. **P < 0.01 vs. control. C: Transcriptional expression of KDR in HAECs after 12 hours of sirolimus (10 nmol/L) or paclitaxel (10 nmol/L) treatment. D: VEGF secretion from HASMCs after 24 hours of sirolimus (10 nmol/L) or paclitaxel (10 nmol/L) treatment. All values are expressed as mean ± SEM. n = 5 per group. **P < 0.01 vs. control without sirolimus or paclitaxel treatment.
Figure 4
Figure 4
Sirolimus and Paclitaxel differentially induce endothelial autophagy. A: Representative images of HAECs stained with antibody against cleaved caspase-3 after 12 hours of sirolimus (10 nmol/L) or paclitaxel (10 nmol/L) treatment. B: Quantification of activated-caspase3-positive cells treated with sirolimus (10 nmol/L) or paclitaxel (10 nmol/L) relative to control group. Values are expressed as mean ± SEM. n = 6 per group. **P < 0.01 vs. control. C: EM of HAECs treated with sirolimus (10 nmol/L) or paclitaxel (10 nmol/L) for 18 hours (upper panel: ×26, 000, lower panel: ×52, 000). Blue arrows indicate typical features of autophagy with formation of autophagosomes. n = 4 per group. D: Representative fluorescent images of HAECs, which were transfected with GFP-LC3 or GFP construct and cultured with sirolimus (10 nmol/L) or paclitaxel (10 nmol/L) for 18 hours. Enhanced LC3 spots in the cytoplasm indicated autophagic cells. Graph shows quantification of autophagic cells with five or more LC3spots. n = 4 per group. *P < 0.05, **P < 0.01 vs. control.
Figure 5
Figure 5
Imaging of autophagic endothelium. Representative fluorescent images of endothelial layers from GFP-LC3 trangenic mice or those from wild-type mice after 24 hours of tissue culture with sirolimus (10 nmol/L) or paclitaxel (10 nmol/L). Enhanced GFP/LC3 expression indicates autophagic endothelium. Graph shows quantification of autophagy. n = 8 per group. *P < 0.05, **P < 0.01 vs. control.
Figure 6
Figure 6
Molecular alterations in HAECs after treatment with Sirolimus or Paclitaxel. Immunoblot analysis of HAECs was performed after 3 or 24 hours of sirolimus or paclitaxel treatment. Antibodies against LC3B, p53, Bcl-2, Bax, pAkt, pERK, and Actin were used. n = 4 per group.
Figure 7
Figure 7
Effects of autophagy inhibition on sirolimus- or paclitaxel-induced impairment of re-endothelialization and revascularization. A: EM of HAECs treated with sirolimus alone (upper panel) or ECs treated with both sirolimus (10 nmol/L) and 3-MA (1 mmol/L) (lower panel). B: HAECs cell number in the presence of sirolimus (10 nmol/L), paclitaxel (10 nmol/L) or 3-MA (1 mmol/L). n = 6 per group. **P < 0.01 vs. control group without treatment. *P < 0.05 vs. group with sirolimus. C: Inhibition of endothelial autophagy by 3-MA (1 mmol/L) attenuated sirolimus-induced impairment of re-endothelialization on day 7, whereas no attenuation of paclitaxel-induced impairment was observed. Values of % re-endothelialization below zero indicate damage of unscratched endothelium. n = 8 per group. **P < 0.01 vs. control group. *P < 0.05 vs. group with sirolimus. NS means no significant difference between two groups. D: Treatment with 3-MA attenuates sirolimus-induced impairment of aortic revascularization on day 4, while no attenuation of paclitaxel-induced impairment was observed. Values are expressed as mean ± SEM. n = 8 per group. **P < 0.01 vs. control. #P < 0.05 vs. sirolimus alone.

References

    1. Suzuki T, Kopia G, Hayashi S, Bailey LR, Llanos G, Wilensky R, Klugherz BD, Papandreou G, Narayan P, Leon MB, Yeung AC, Tio F, Tsao PS, Falotico R, Carter AJ. Stent-based delivery of sirolimus reduces neointimal formation in a porcine coronary model. Circulation. 2001;104:1188–1193. - PubMed
    1. Axel DI, Kunert W, Göggelmann C, Oberhoff M, Herdeg C, Küttner A, Wild DH, Brehm BR, Riessen R, Köveker G, Karsch KR. Paclitaxel inhibits arterial smooth muscle cell proliferation and migration in vitro and in vivo using local drug delivery. Circulation. 1997;96:636–645. - PubMed
    1. Wessely R, Schömig A, Kastrati A. Sirolimus and paclitaxel on polymer-based drug eluting stents: similar but different. J Am Coll Cardiol. 2006;47:708–714. - PubMed
    1. Stettler C, Wandel S, Allemann S, Kastrati A, Morice MC, Schömig A, Pfisterer ME, Stone GW, Leon MB, de Lezo JS, Goy JJ, Park SJ, Sabaté M, Suttorp MJ, Kelbaek H, Spaulding C, Menichelli M, Vermeersch P, Dirksen MT, Cervinka P, Petronio AS, Nordmann AJ, Diem P, Meier B, Zwahlen M, Reichenbach S, Trelle S, Windecker S, Jüni P. Outcomes associated with drug-eluting and bare-metal stents; a collaborative network meta-analysis. Lancet. 2007;370:937–948. - PubMed
    1. McFadden EP, Stabile E, Regar E, Cheneau E, Ong AT, Kinnaird T, Suddath WO, Weissman NJ, Torguson R, Kent KM, Pichard AD, Satler LF, Waksman R, Serruys PW. Late thrombosis in drug-eluting coronary stents after discontinuation of antiplatelet therapy. Lancet. 2004;364:1519–1521. - PubMed

Publication types

MeSH terms