. 2009;4(11):1565-73.
doi: 10.1038/nprot.2009.187. Epub 2009 Oct 8.

Quantification of oxygen-induced retinopathy in the mouse: a model of vessel loss, vessel regrowth and pathological angiogenesis

Affiliations

Quantification of oxygen-induced retinopathy in the mouse: a model of vessel loss, vessel regrowth and pathological angiogenesis

Kip M Connor et al. Nat Protoc. 2009.

Abstract

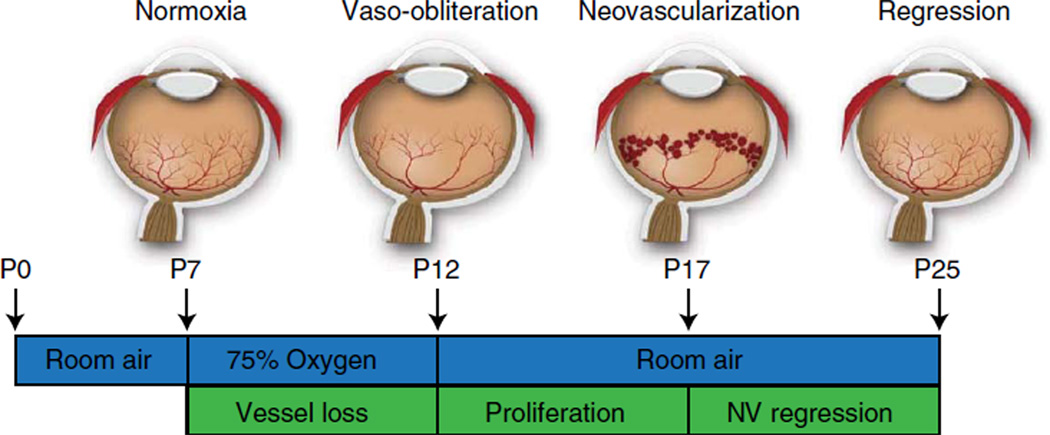
The mouse model of oxygen-induced retinopathy (OIR) has been widely used in studies related to retinopathy of prematurity, proliferative diabetic retinopathy and in studies evaluating the efficacy of antiangiogenic compounds. In this model, 7-d-old (P7) mouse pups with nursing mothers are subjected to hyperoxia (75% oxygen) for 5 d, which inhibits retinal vessel growth and causes significant vessel loss. On P12, mice are returned to room air and the hypoxic avascular retina triggers both normal vessel regrowth and retinal neovascularization (NV), which is maximal at P17. Neovascularization spontaneously regresses between P17 and P25. Although the OIR model has been the cornerstone of studies investigating proliferative retinopathies, there is currently no harmonized protocol to assess aspects of angiogenesis and treatment outcome. In this protocol we describe standards for mouse size, sample size, retinal preparation, quantification of vascular loss, vascular regrowth, NV and neovascular regression.


Figures

Figure 1
Figure 1
Cartoon schematic of the mouse OIR model. Neonatal mice and their nursing mother are kept in room air from birth through P7 and normal vascular development ensues. At P7, mice are exposed to 75% oxygen, which inhibits retinal vessel growth and causes significant vessel loss. Mice are returned to room air at P12; the avascular retina becomes hypoxic, triggering both normal vessel regrowth and a pathological neovascular response. Neovascularization (NV) reaches its maximum at P17. Shortly thereafter, the NV spontaneously regresses, and the retina reaches resolution by P25.
Figure 2
Figure 2
Vasculature and quantification of P12H vaso-obliteration. (a) Image of ×5 P12H retinal whole-mount stained for endothelial cells with isolectin B4-594 and obtained using the Zeiss AxioCam MRm, Zeiss AxioObserver.Z1 microscope and AxioVision 4.6.3.0 software. (b) Screenshot of one retinal quadrant with the total vascular area traced. The tools used to obtain total retinal area in CS4 photoshop, the Polygonal Lasso Tool and the ‘Add to selection’ function, are highlighted by the red arrows. (c) ×5 P12H retinal whole-mount with the avascular area (vaso-obliterated area) highlighted. (d) Screenshot of one retinal quadrant with quantification of avascular zone. The functions and settings utilized, the ‘Lasso Tool’ and ‘Subtract from selection,’ are highlighted by red arrows. (e) ×5 P12H retinal whole-mount with the total avascular area highlighted in white. (f) Histogram function with ‘Refresh’ key, and pixel record highlighted by red arrow. Once the desired area is outlined, click the ‘Refresh’ key and record the number of pixels in the area. Scale bars are 1,000 µm. These studies adhered to the Association for Research in Vision and Ophthalmology (ARVO) Statement for the Use of Animals in Ophthalmic and Vision Research and were approved by the Children’s Hospital Boston Animal Care and Use Committee.
Figure 3
Figure 3
Quantification of vaso-obliteration and neovascularization (NV) at P17H. (a) Image of ×5 P17H retinal whole-mount stained for endothelial cells with isolectin B4-594 and obtained using a Zeiss AxioCam MRm, Zeiss AxioObserver.Z1 microscope and AxioVision 4.6.3.0 software. (b) Screenshot of a retinal quadrant with the avascular area highlighted. The tools necessary to make this measurement are highlighted by red arrows: the Lasso Tool and ‘subtract from selection’ keys. As at P12, this measurement should be made after finding the pixels in total retina. (c) P17H retinal whole-mount with entire avascular (vaso-obliterated) area highlighted in white. (d) Screenshot of a retinal quadrant with the neovascular tufts highlighted. The necessary tools and settings are noted with red arrows; use the ‘magic wand’ and ‘add to selection’ tools to highlight NV. The tolerance should be set to 50, and the ‘anti-alias’ and ‘contiguous’ boxes should be checked. (e) One quadrant of a retina with NV highlighted in white. (f) ×5 P17H retinal whole-mount with all neovascular tufts highlighted in white. Scale bars represent 1,000 µm. These studies adhered to the Association for Research in Vision and Ophthalmology (ARVO) Statement for the Use of Animals in Ophthalmic and Vision Research and were approved by the Children’s Hospital Boston Animal Care and Use Committee.
Figure 4
Figure 4
Quantification of neovascularization (NV) during regression: P18H–P25H. (a) Image of ×5 retinal whole-mount at P21H stained for endothelial cells with isolectin B4-594 and obtained using Zeiss AxioCam MRm, Zeiss AxioObserver.Z1 microscope, and AxioVision 4.6.3.0 software. (b) Screenshot of a P21H retinal quadrant with the NV highlighted. The necessary tools and settings are noted with red arrows. Use the ‘magic wand’ and ‘add to selection’ tools to highlight NV. The tolerance should be set to 30 or lower and the ‘anti-alias’ and ‘contiguous’ boxes should be checked. (c) ×5 P21H retinal whole-mount with all NV highlighted in white. (d) ×5 retinal whole-mount at P25H stained with isolectin B4-594. (e) Screenshot of a P25H retinal quadrant with the NV highlighted. White arrows point to background artifacts or precipitates that do not connect to vessels. Red arrows indicate tools and settings as listed above in (b). (f) ×5 P25H retinal whole-mount with all NV highlighted in white. Scale bars are 1,000 µm. These studies adhered to the Association for Research in Vision and Ophthalmology (ARVO) Statement for the Use of Animals in Ophthalmic and Vision Research and were approved by the Children’s Hospital Boston Animal Care and Use Committee.

References

    1. Chen J, Connor KM, Aderman CM, Smith LE. Erythropoietin deficiency decreases vascular stability in mice. J. Clin. Invest. 2008;118:526–533. - PMC - PubMed
    1. Smith LE, et al. Regulation of vascular endothelial growth factor-dependent retinal neovascularization by insulin-like growth factor-1 receptor. Nat. Med. 1999;5:1390–1395. - PubMed
    1. Smith LE, et al. Essential role of growth hormone in ischemia-induced retinal neovascularization. Science. 1997;276:1706–1709. - PubMed
    1. Connor KM, et al. Increased dietary intake of omega-3-polyunsaturated fatty acids reduces pathological retinal angiogenesis. Nat. Med. 2007;13:868–873. - PMC - PubMed
    1. Palmer EA, et al. Incidence and early course of retinopathy of prematurity. The Cryotherapy for Retinopathy of Prematurity Cooperative Group. Ophthalmology. 1991;98:1628–1640. - PubMed

Publication types