

doi: 10.1038/nbt.1567.
How to visually interpret biological data using networks
Affiliations
- PMID: 19816451
- PMCID: PMC4154490
- DOI: 10.1038/nbt.1567
Item in Clipboard
How to visually interpret biological data using networks
Nat Biotechnol.
2009 Oct.
Abstract
Networks in biology can appear complex and difficult to decipher. We illustrate how to interpret biological networks with the help of frequently used visualization and analysis patterns.
Figures
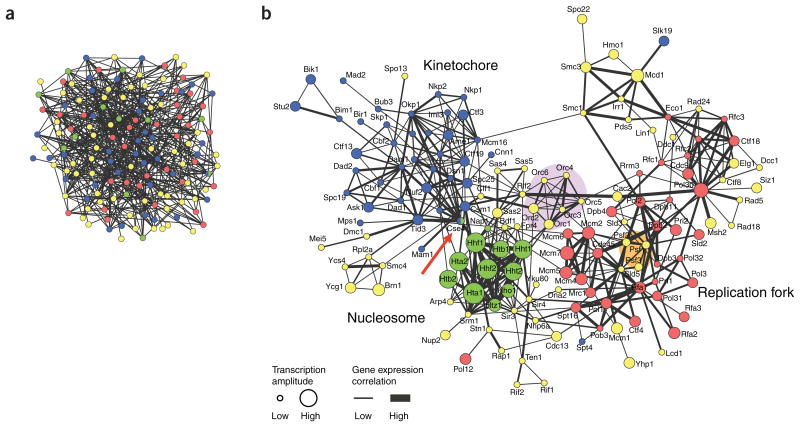
Network visualization of chromosome maintenance and duplication machinery in baker's yeast, Saccharomyces cerevisiae. Nodes represent proteins that are annotated as being located on the chromosome by the Gene Ontology project (for clarity, the suffix ‘p’ has been removed from yeast protein names). Node colors specify chromosomal location subcategories: red, replication fork; green, nucleosome; blue, kinetochore; yellow, other chromosome components. Edges represent protein-protein interactions that were manually extracted from publications by BioGRID database curators (which could include small- and large-scale experiments). (a) Without specific layout, the network looks like a ‘jumbled mess’ and cannot be interpreted. (b) The same network after applying the force-directed layout and adding gene expression data of cells monitored during one round of the cell cycle are visually annotated on the network (data are from ref. 8). Edges are drawn thicker when the Pearson correlation between transcript profiles is higher. Node size corresponds to the transcriptional amplitude (root mean square of the time-course expression values), which is a measure of how much expression changes over the cell cycle. The network was visualized using Cytoscape software. Interesting regions were manually emphasized (shading and red arrow) and node labels placed for clarity using Adobe Illustrator.
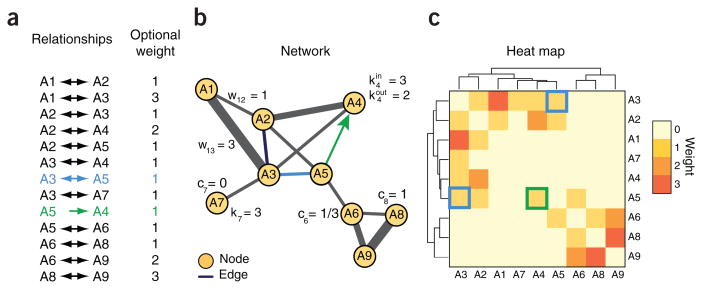
Mathematical representation of networks and three alternate visualizations of the same data. (a) List of relationships with optional ‘weight’ (often denoted with the letter w), which represent attributes such as relationship significance or stength. Relationships can be undirected (e.g., A3 ↔ A5, shown in blue) or directed (e.g., A5 → A4, shown in green). (b) Network view. Networks are mathematically grounded in the field of graph theory, in which they are commonly denoted G = (V, E), (G, graph; V, a set of vertices or nodes; E, a set of edges). Some commonly encountered mathematical concepts include the node degree (ki), which is the number of edges attached to a node, and the clustering coefficient (ci), which counts the number of edges among the neighbors of a node, divided by the maximal possible number of such edges. If edges have directions, it is useful to distinguish between the in-degree (kini) and the out-degree (kouti). The node degree distribution and average clustering coefficient have been used to characterize different types of networks. (c) Heat map view. Nodes are represented along the sides of the heat map and elements of the map (small squares) are colored according to edge weight, with higher weights having a darker color. Similar rows and columns are placed adjacent to each other, as shown by the similarity tree on each map axis. This view is useful for finding nodes with similar neighbors.
References
Publication types
MeSH terms
Grants and funding
LinkOut - more resources
Full Text Sources
Other Literature Sources
