. 2009 Oct;5(10):e1000610.
doi: 10.1371/journal.ppat.1000610. Epub 2009 Oct 9.

IL-10 signaling blockade controls murine West Nile virus infection

Affiliations

IL-10 signaling blockade controls murine West Nile virus infection

Fengwei Bai et al. PLoS Pathog. 2009 Oct.

Abstract

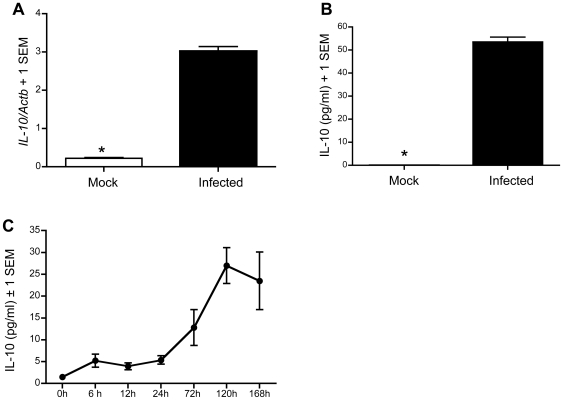
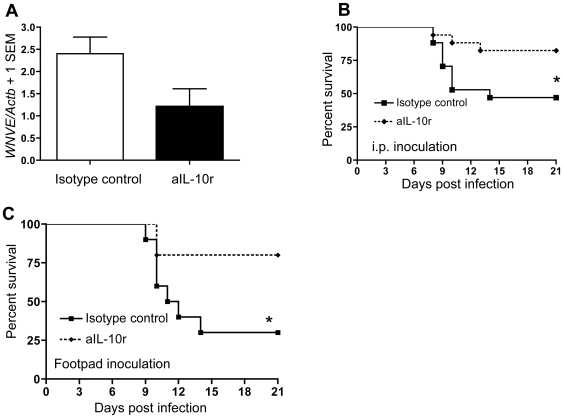
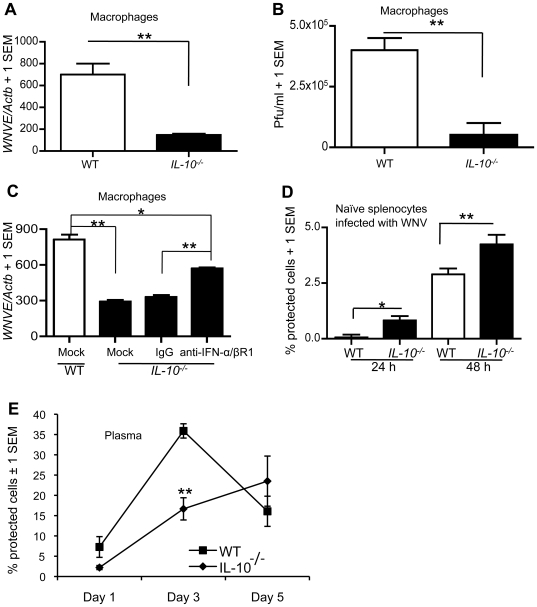
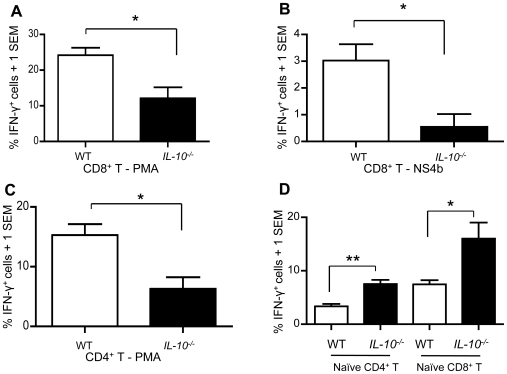
West Nile virus (WNV), a mosquito-borne single-stranded RNA flavivirus, can cause significant human morbidity and mortality. Our data show that interleukin-10 (IL-10) is dramatically elevated both in vitro and in vivo following WNV infection. Consistent with an etiologic role of IL-10 in WNV pathogenesis, we find that WNV infection is markedly diminished in IL-10 deficient (IL-10(-/-)) mice, and pharmacologic blockade of IL-10 signaling by IL-10 neutralizing antibody increases survival of WNV-infected mice. Increased production of antiviral cytokines in IL-10(-/-) mice is associated with more efficient control of WNV infection. Moreover, CD4(+) T cells produce copious amounts of IL-10, and may be an important cellular source of IL-10 during WNV infection in vivo. In conclusion, IL-10 signaling plays a negative role in immunity against WNV infection, and blockade of IL-10 signaling by genetic or pharmacologic means helps to control viral infection, suggesting a novel anti-WNV therapeutic strategy.


Conflict of interest statement

The authors have declared that no competing interests exist.

Figures

Figure 1
Figure 1. IL-10 expression is elevated in vitro and in vivo upon WNV infection.
Thioglycollate-elicited peritoneal macrophages from C57BL/6 mice were infected with WNV (MOI = 1) for 24 hours. (A), IL-10 mRNA was measured by Q-PCR and normalized to mouse β-actin (Actb; unitless ratio+1 SEM). (B), ELISA results are shown for IL-10 protein (pg/ml) in the media. (C), Plasma was prepared at selected time points from C57BL/6 mice infected with WNV (LD50), and IL-10 (pg/ml) was measured by ELISA. * p<0.001.
Figure 2
Figure 2. IL-10 signaling facilitates WNV infection.
Wild-type (WT, C57BL/6) or IL-10−/− mice were i.p. challenged with WNV (LD50). (A), Q-PCR was performed for WNVE in peripheral blood on days 1 (IL-10−/− mice, n = 14 and WT mice, n = 10) and 3 (IL-10−/− mice, n = 14 and WT mice, n = 9) p.i.. (B), Q-PCR was performed for WNVE in spleens on day 3 (n = 5/group) and brains on day 7 (IL-10−/− mice, n = 7 and WT mice, n = 9) p.i.. (C), Perfused brains were isolated on day 7 p.i., and WNV antigen (green signal), CD45 (leukocyte common antigen, red signal) and neurons (MAP2, blue signal) were detected by confocal microscopy (OB: Olfactory bulb). These images represent 9 mice per group in 3 independent experiments. (D), Kaplan-Meier survival analysis of IL-10−/− and WT mice after i.p. inoculation of WNV (n = 30/group). Data shown are pooled from 3 independent experiments. (E), Survival analysis after WNV inoculation by footpad injection (IL-10−/− mice, n = 8 and WT mice n = 10). Data (means+1 SEM) are pooled results from 2–3 similar independent experiments. *p<0.05 and **p<0.01, compared to control mice.
Figure 3
Figure 3. Prophylactic blockade of IL-10 signaling increases survival of WNV-infected mice.
A group of C57BL6 mice were i.p. administered anti-IL-10 receptor monoclonal antibody (aIL-10r mAb) or isotype-matched IgG control antibody one day before challenge with WNV. (A), Viral load was measured in blood on day 3 p.i. by Q-PCR (p = 0.07, LD50, i.p..); (B–C), Kaplan-Meier survival analysis showed significant differences between the aIL-10r mAb and isotype-matched IgG treated group. (B, i.p. inoculation [LD50], n = 17/group, data were pooled from 3 independent experiments; C, footpad inoculation [100 pfu], n = 10/group). *p<0.05, compared to control mice.
Figure 4
Figure 4. Immune cells and mice deficient in IL-10 produce more antiviral cytokines.
Thioglycollate elicited peritoneal macrophages from IL-10−/− and wild-type (WT) mice were challenged with WNV (MOI = 1) or PBS (mock infection) for 24 hours. (A–C), TNF-α, IFN-α and IFN-β were measured in media by ELISA. (D), Total RNA from macrophages was analyzed for IL-12/23 p40 mRNA expression by Q-PCR. The data are normalized to mouse β-actin mRNA and are expressed as the relative fold increase over normalized RNA from mock controls. (E), Splenocytes isolated from naïve IL-10−/−and WT mice were infected with WNV (MOI = 0.5), and IL-12/23 p40 production was measured in media by ELISA. (F and G) Splenocytes isolated from WNV-infected IL-10−/− or WT mice on day 3 p.i. (LD50, i.p.) were stimulated by WNV NS4b peptide (1×10⁶ cells, 1.0 µg/ml) for 24 or 48 hours. TNF-α (F) and IL-12/23 p40 (G) were measured in media by ELISA. (H and I) WT and IL-10−/− mice were i.p. challenged with WNV (LD50) and bled on day 1, day 2 and 3 p.i., and IL-12/23 p40 (H) and TNF-α (I) were measured in plasma by ELISA. (J), Expression of IFN-γ (Ifng) was measured in peripheral blood by Q-PCR. These data are representative of two independent experiments, with animal numbers ≥4 per group. *p<0.05, **p<0.01 and ***p<0.001.
Figure 5
Figure 5. Type I IFN is associated with inhibition of WNV infectivity in vitro.
(A–B) One million thioglycollate-elicited peritoneal macrophages isolated from IL-10−/− and WT mice were infected with WNV (MOI = 1) for 24 hours. (A), WNVE was measured in macrophages by Q-PCR and (B) viral load was measured in media by plaque formation assay. (C), Macrophages from IL-10−/− mice were treated with or without (mock) 20 µg/ml of either normal rabbit IgGs or rabbit anti-IFNα/βR1 IgGs (R&D Biosystems) for 2 h followed by WNV infection (MOI = 1) for 24 h. WNVE was measured in macrophages by Q-PCR. (D), Splenic cells isolated from naïve WT and IL-10−/− mice were infected with WNV (MOI = 0.5). Type I IFN level in the medium was measured by IFN bioassay. (E), WT and IL-10−/− mice were inoculated with WNV (LD50, i.p.) and type I IFN level was measured by IFN bioassay. *p<0.05 and **p<0.01.
Figure 6
Figure 6. CD4+ and CD8+ T cells deficient in IL-10 produce less IFN-γ.
(A–C) IL-10−/− and wild-type (WT) mice were i.p. challenged with WNV (LD50). On day 7, mice were euthanized and splenocytes were isolated and stimulated with PMA or WNV NS4b peptide for 6 hours. Flow cytometry analysis of IFN-γ-producing CD8+ T cells after stimulation with (A) PMA or (B) with WNV NS4b peptide was then carried out. (C), Flow cytometry analysis of IFN-γ producing CD4+ T cells after stimulation with PMA is shown. These data represent two independent experiments (n = 4/group). (D), Splenocytes were isolated from naïve IL-10−/− and WT mice and stimulated with PMA for 6 hours. Flow cytometry analysis of IFN-γ-producing CD4+ and CD8+ T cells is shown (n = 3/group). * p<0.05 and **p<0.01.
Figure 7
Figure 7. Pharmacologic neutralization of IL-10 increases survival of WNV-infected mice.
Wild-type (WT) mice were i.p. challenged with WNV (LD50). Mice received two i.p. injections of anti-IL-10 monoclonal antibody (aIL-10 mAb, 200 µg/dose) or isotype control IgG on day 2 and day 3 p.i. (p<0.05, n = 15/group). Data were pooled from three independent experiments. * p<0.05.
Figure 8
Figure 8. CD4+ T cells produce copious amounts of IL-10 in vivo during WNV infection.
GFP gene knock-in tiger and wild-type (WT, C57BL/6) mice were i.p. challenged with WNV (LD50). Splenocytes isolated from WNV-infected tiger mice at selected time points p.i. were stained for surface markers (day 0, uninfected splenocytes). GFP was used as a surrogate for IL-10 expression, and analyzed by flow cytometry. (A), Percentages of GFP positive cells are shown within CD11b+ (macrophages), CD11c+ (dendritic cells), CD19+ (B cells), non-CD4+ (CD3+CD4) T cells or CD4+ (CD3+CD4+) T cells populations. Dot-plot figures are representative of at least two independent experiments (n≥2 for each experiment). (B), RAG1−/− mice were reconstituted with CD4+ T cells from naïve WT or IL-10−/− mice (1×10⁷ cells/mouse) or with PBS as control one day prior to WNV challenge (LD50, i.p.). Mice were bled at selected time points and IL-10 production was measured in plasma by ELISA (**p<0.01, RAG1−/− mice reconstituted with CD4+ T cells from WT mice were compared to control mice, n≥3/group).

References

    1. Petersen LR, Marfin AA. West Nile virus: a primer for the clinician. Ann Intern Med. 2002;137:173–179. - PubMed
    1. Gould LH, Fikrig E. West Nile virus: a growing concern? J Clin Invest. 2004;113:1102–1107. - PMC - PubMed
    1. Moore KW, de Waal Malefyt R, Coffman RL, O'Garra A. Interleukin-10 and the interleukin-10 receptor. Annu Rev Immunol. 2001;19:683–765. - PubMed
    1. Kuhn R, Lohler J, Rennick D, Rajewsky K, Muller W. Interleukin-10-deficient mice develop chronic enterocolitis. Cell. 1993;75:263–274. - PubMed
    1. Gazzinelli RT, Wysocka M, Hieny S, Scharton-Kersten T, Cheever A, et al. In the absence of endogenous IL-10, mice acutely infected with Toxoplasma gondii succumb to a lethal immune response dependent on CD4+ T cells and accompanied by overproduction of IL-12, IFN-gamma and TNF-alpha. J Immunol. 1996;157:798–805. - PubMed

Publication types