Review
. 2009;19(4):319-38.
doi: 10.1615/critreveukargeneexpr.v19.i4.50.

Mechanical signaling for bone modeling and remodeling

Affiliations
Review

Mechanical signaling for bone modeling and remodeling

Alexander G Robling et al. Crit Rev Eukaryot Gene Expr. 2009.

Abstract

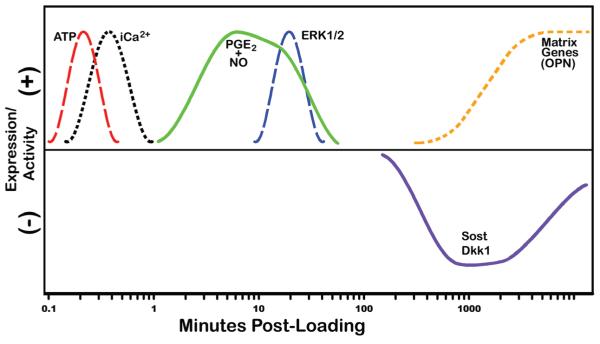
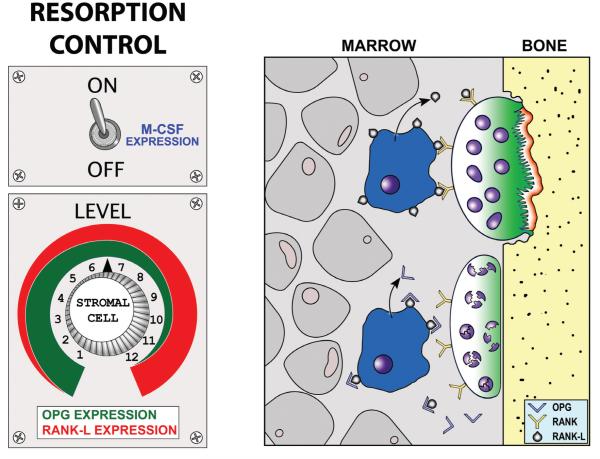
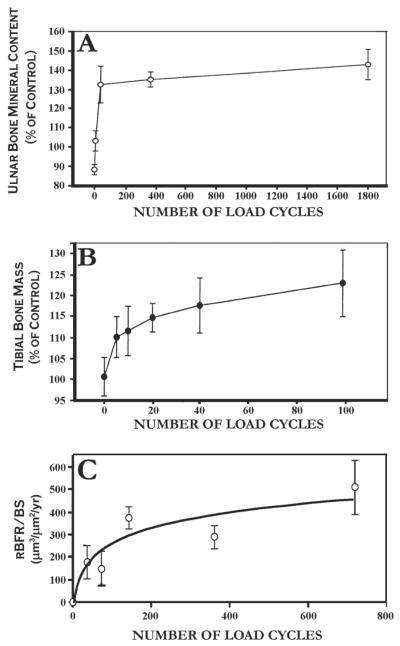
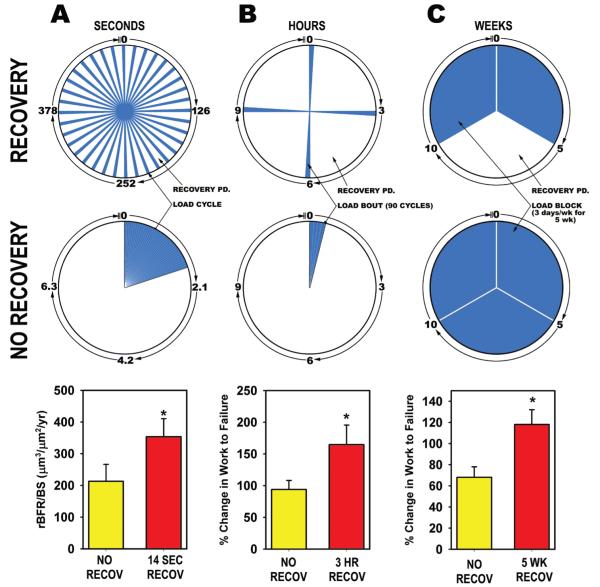
Proper development of the skeleton in utero and during growth requires mechanical stimulation. Loading results in adaptive changes in bone that strengthen bone structure. Bone's adaptive response is regulated by the ability of resident bone cells to perceive and translate mechanical energy into a cascade of structural and biochemical changes within the cells a process known as mechanotransduction. Mechanotransduction pathways are among the most anabolic in bone, and consequently, there is great interest in elucidating how mechanical loading produces its observed effects, including increased bone formation, reduced bone loss, changes in bone cell differentiation and lifespan, among others. A molecular understanding of these processes is developing, and with it comes a profound new insight into the biology of bone. In this article, we review the nature of the physical stimulus to which bone cells mount an adaptive response, including the identity of the sensor cells, their attributes and physical environment, and putative mechanoreceptors they express. Particular attention is allotted to the focal adhesion and Wnt signaling, in light of their emerging role in bone mechanotransduction. Te cellular mechanisms for increased bone loss during disuse, and reduced bone loss during loading are considered. Finally, we summarize the published data on bone cell accommodation, whereby bone cells stop responding to mechanical signaling events. Collectively, these data highlight the complex yet finely orchestrated process of mechanically regulated bone homeostasis.


Figures

FIGURE 1
FIGURE 1
The stress directions in a curved crane (Left) estimated by the Swiss engineer Culmann compared with the drawings of trabecular trajectories in the proximal femur by Swiss anatomist von Meyer (Right).
FIGURE 2
FIGURE 2
Radiographs of tibiae from two newborns with reduced loading of the tibia due to (A) congenital neuromuscular disease and (B) spina-bifida. The reduced mechanical environment of the tibia results in a narrow, underdeveloped diaphysis that remains circular and small, rather than triangular and large, in cross section. (A) Reprinted from Rodríguez et al. with permission from Springer-Verlag New York Inc. (B) Reprinted from Ralis et al. with permission from Cambridge University Press.
FIGURE 3
FIGURE 3
Comparison between the humerus cross-section in the playing arm and nonplaying arm of a professional tennis player. The periosteal circumference of the humerus in the playing arm has expanded substantially and there is also a slight expansion of the marrow cavity. Reprinted from Jones et al. with permission from the publisher (Journal of Bone and Joint Surgery).
FIGURE 4
FIGURE 4
In situ hybridization for c-fos mRNA in rat vertebral bone. (A) Vertebral cortex hybridized for c-fos mRNA 1 h after applied mechanical loading. (B) Similar region of the vertebral cortex from a nonloaded control vertebra hybridized for c-fos mRNA. Reprinted from Lean et al. with permission from The American Physiological Society.
FIGURE 5
FIGURE 5
Dynamic, cyclical loading produces new bone formation whereas static, stationary loading does not.10 Here we see ulna sections that were loaded similarly, except the bone on top received stationary loading and the bone below received cyclic loading at 2 cycles/sec. Fluorochrome (yellow) labels indicate the bone boundary at the beginning and end of the experiment. It is clear that a significant amount of new bone was formed under cyclic loading. The new bone can be seen on the medial (Top) and lateral (Bottom) bone surfaces where the mechanical strain within the bone tissue is highest. Reprinted from Robling et al. with permission from Elsevier.
FIGURE 6
FIGURE 6
Physical deformations of bone tissue that occur during functional use (e.g., muscle contractions) create hydrostatic pressure gradients within bone’s lacunar-canalicular network. As those pressure gradients are equilibrated via movement of extracellular fluid from regions of high pressure to regions of low pressure, the glycocalyx (a structure that suspends/tethers the osteocyte cell membrane to the canalicular wall) is exposed to drag forces from the fluid, which create a “hoop strain” on the cell process. This hoop strain is one mechanism by which smaller strains in the tissue can be amplified to larger strains at the cell surface by fluid movement.
FIGURE 7
FIGURE 7
Bone is more sensitive to loading at higher loading frequencies. (Left) The graph on the left shows dose-response curves for the bones’ response to mechanical loading at 1 cycle/sec (Hz), 5 Hz, and 10 Hz.13 The y-axis is average bone formation rate and the x-axis is the peak strain engendered in the bone tissue. (Right) The graph on the right shows the minimum strain needed to initiate bone formation. This value is 1820 microstrain at 1 Hz but drops to 1180 microstrain at 5 Hz and to only 650 microstrain at 10 Hz. Reprinted from Hsieh and Turner with permission from the publisher (American Society for Bone and Mineral Research).
FIGURE 8
FIGURE 8
Bone turnover (remodeling) increases in states of disuse (Left) and overuse (Right). A physiological window falls between the extreme loading conditions, in which bone turnover is low. Bone formation at the periosteal bone surfaces is also affected by mechanical loading, but the relationship is different. Periosteal bone formation is very low in states of disuse and increases with increasing mechanical stimulus. Reprinted from Robling et al., Annual Review of Biomedical Engineering ©2006 by Annual Reviews.
FIGURE 9
FIGURE 9
The forelimb loading system causes the ulna to bow, which produces a distinct distribution of strain energy within the bone tissue. The highest strain energy is shown in red and the lowest in white. The amount of new bone formed in response to loading is proportional to the strain energy magnitude. A cross-section from a rat ulna is shown in the right panel. This rat was subjected to forelimb loading 3 times/wk for 16 weeks. The duration of each loading session was only 3 min. This short loading program substantially changed the shape of the bone section. The red line is a label showing the outline of the bone at the beginning of the experiment. One can clearly see where the bone was formed and these locations correspond with the red and orange regions in the middle panel.
FIGURE 10
FIGURE 10
Sclerostin mediation of Lrp5 signaling during mechanical loading. (Bottom) In the unstimulated state, osteocytes produce and secrete an ample supply of sclerostin, which serves to keep Wnt signaling low in the nearby osteoblast populations by antagonizing the LRP5 receptor. This process keeps β-catenin levels low (high level of Gsk-mediated β-catenin degradation). (Top) After mechanical stimulation, sclerostin levels drop and LRP5 becomes more available for Wnt binding, which triggers the accumulation of β-catenin in the cytosol, and eventually, the nucleus.
FIGURE 11
FIGURE 11
Mechanical stimulation of the rodent forearm induces a decrease in Sost and Dkk1 mRNA after 2 days, whereas hinblimb unloading (disuse) induces an increase Sost but not Dkk1 transcripts after 3 days. sFrp1, another secreted Wnt pathway antagonist, remains unchanged by either stimulus. Reprinted from Robling et al. with permission from the publisher (American Society for Biochemistry and Molecular Biology).
FIGURE 12
FIGURE 12
Mechanical stimuli may be sensed by mechanically sensitive ion channels (MSC), voltage sensitive ion channels (VSC), G protein-coupled mechanoreceptors (GPCR), or the focal adhesion complex made up of trans membrane integrins (IGRN) and several signaling molecules including focal adhesion kinase (FAK) and proline-rich tyrosine kinase 2 (PYK2).
FIGURE 13
FIGURE 13
Timeline of major mechanotransduction signaling events. Within 1 minute of loading, bone cells activate Ca2+ signaling and release a bolus of ATP. A few minutes later, prostaglandin E2 (PGE2) and nitric oxide (NO) are released, followed by MAP-kinase signaling (ERK1/2 activation), Sost/Dkk1 downregulation, and ultimately, the expression of bone matrix genes, including osteopontin and collagen.
FIGURE 14
FIGURE 14
Molecular control of bone resorption by the stroma-derived cell population. (Left) The stromal cells can be thought of as a rheostat in the resorptive process. M-CSF is required to activate the system, and once activated, the relative levels of RANK-L and OPG control osteoclastogenesis and resorptive activity. (Right) Both RANK receptors on the osteoclast (and pre-osteoclast) surface, and the soluble decoy OPG receptors in the extracellular fluid, bind RANK-L. The level of RANK-L and OPG therefore control the resorptive signal.
FIGURE 15
FIGURE 15
Bone mass and formation rates saturate relatively soon after a mechanical stimulus is initiated, as demonstrated by (A) the transcortically pinned turkey ulna, (B) the jumping rat model, and (C) in our lab using the rat tibia 4-point bending model.
FIGURE 16
FIGURE 16
Recovery periods on several time scales restore sensitivity to mechanical loading in bone cells. Mechanical stimulation is represented by blue wedges; recovery periods are represented by white wedges. Columns A-C represent the experimental designs (pie charts) and results (bar charts) of three separate mechanical loading experiments designed to reveal the effects of allowing bone cells to recover from individual mechanical loading cycles, bouts, and blocks. (A) Rat tibiae were administered 36 load cycles/day in a single daily bout for 2 weeks. Some of the rats were given 36 back-to-back cycles (lower pie chart), while others were given 14 seconds of recovery between each of their 36 daily cycles (upper pie chart). The relative bone formation rate was significantly greater in the recovery group compared to the back-to-back-cycles group, despite the fact that both groups received identical mechanical inputs. (B) Rat ulnae were subjected to 4 four bouts of loading per day (90 load cycles per bout), 3 days/wk for 16 weeks. Some of the rats were given all 4 bouts back to back (lower pie chart), while others were allotted 3 h between each of the bouts (upper pie chart). The increase in ulnar work to failure, a measure of whole bone toughness, was significantly greater in the recovery group compared to the back-to-back-bouts group, despite the fact that both groups received identical mechanical inputs. (C) Rat ulnae were exposed to two (upper pie chart) or three (lower pie chart) 5-week blocks of loading. The group exposed to only 2 blocks of loading was given a 5-week recovery period in the middle of the experiment. The recovery period group exhibited significantly greater ulnar work to failure, despite receiving less mechanical stimulation than the 15-week continuous loading group.

References

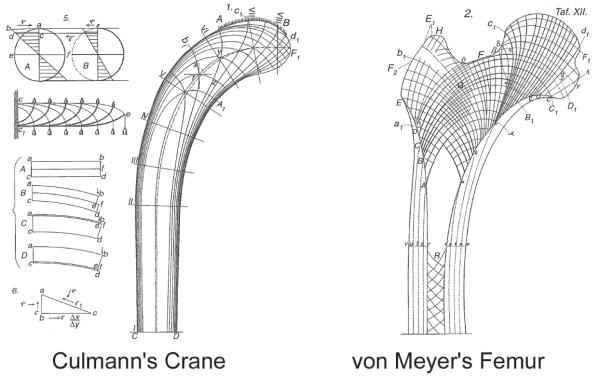
    1. Wolff J. The law of bone transformation. A. Hirschwald; Berlin: 1892.
    1. Murray PDF . Bones – A study of the development and structure of the vertebrate skeleton. Cambridge University Press; Cambridge: 1936.
    1. von Meyer C. Die architektur der spongiosa. Arch Anat Physiol Wiss Med Reichert DuBois-Reymonds Arch. 1867;34:615–28.
    1. Rodriguez JI, Palacios J, Garcia-Alix A, Pastor I, Paniagua R. Effects of immobilization on fetal bone development. A morphometric study in newborns with congenital neuromuscular diseases with intrauterine onset. Calcif Tissue Int. 1988;43:335–9. - PubMed
    1. Ralis ZA, Ralis HM, Randall M, Watkins G, Blake PD. Changes in shape, ossification and quality of bones in children with spina bifida. Dev Med Child Neurol Suppl. 1976:29–41. - PubMed

Publication types

MeSH terms

Substances