. 2009 Oct 16;31(4):654-64.
doi: 10.1016/j.immuni.2009.08.023. Epub 2009 Oct 8.

How punctual ablation of regulatory T cells unleashes an autoimmune lesion within the pancreatic islets

Affiliations

How punctual ablation of regulatory T cells unleashes an autoimmune lesion within the pancreatic islets

Markus Feuerer et al. Immunity. .

Abstract

CD4(+)Foxp3(+) regulatory T cells (Treg cells) are known to control the progression of autoimmune diabetes, but when, where, and how they exert their influence in this context are questions still under vigorous debate. Exploiting a transgene encoding the human diphtheria toxin receptor, we punctually and specifically ablated Foxp3(+) cells in the BCD2.5/NOD mouse model of autoimmune diabetes. Strikingly, overt disease developed within 3 days. The earliest detectable event was the activation of natural killer (NK) cells directly within the insulitic lesion, particularly the induction of Ifng gene expression within 7 hours of Treg cell ablation. Interferon-gamma had a strong impact on the gene-expression program of the local CD4(+) T effector cell population, unleashing it to aggressively attack the islets, which was required for the development of diabetes. Thus, Treg cells regulate pancreatic autoimmunity in situ through control of a central innate immune system player, NK cells.


Figures

Fig. 1
Fig. 1. Generation of Foxp3-DTR BAC transgenic NOD mice and kinetics of the autoimmune attack on the pancreas
(A) BAC construct spanning from 150kb upstream to 70 kb downstream of Foxp3.DTR-eGFP cDNA with stop codon was inserted between the first and second codon of the Foxp3 open reading frame into the first coding exon (exons are highlighted in black). Recombinant Foxp3-DTR-eGFP BAC was injected into NOD. (B) NOD.Foxp3DTR+ were crossed with BDC2.5 TCR tg mice (Katz et al., 1993) and Treg depletion was analyzed. Percentage of Treg cells after two daily injections of DT into BDC2.5/NOD.Foxp3DTR+ and DTR- control littermate. Representative dot plots for axillary LN (axLN), PLN and pancreas tissue are shown. (C–D) DT injections into 4–5 weeks old BDC2.5/NOD.Foxp3DTR+ mice induced a rapid onset of diabetes. (C) Histological sections of pancreas tissue after H&E staining, with two different magnifications of the same area: 10× objective left column, 20× objective right colum. (C, upper panel) BDC2.5/NOD.Foxp3DTR− control animal 120 hours after DT treatment. (C, both middle and lower panel) BDC2.5/NOD.Foxp3DTR+ mice analyzed at different time-points after DT treatment: 24 hours, 72 hours and 120 hours. Arrowheads indicate text-cited areas of infiltration. Representative sections are shown. (D) Diabetes incidence of BDC2.5/NOD.Foxp3DTR+ (n=9) and DTR negative control littermates (n=9) after DT treatment as described in the method section. Arrows indicate days of DT injection.
Fig. 2
Fig. 2. T cell activation and proliferation in the pancreatic lesion
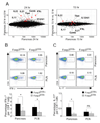
(A–D) Affymetrix M430 2.0 chip data. CD4 T cells were isolated from pancreas lesion and PLN at three different time-points: 0, 15 and 24 hours after DT treatment from BDC2.5/NOD.Foxp3DTR+ mice. (A) Expression versus expression values are plotted for pancreas and PLN at 24 and 15 hours. Numbers indicate count of genes that were more than 2-fold differential expressed. (B–D) Fold-change to fold-change plot. (B) 24 hours versus 0 hour for PLN and pancreas (left panel) and 15 hours versus 0 hour for PLN and pancreas (right panel). Red line in (left panel) represents the linear regression curve. (C) Genes changes after 24 hours (and presented in Supplementary Table S1) are highlighted in the 15 hours versus 0 hour PLN vs. pancreas plot (left panel) and random date control (right panel). (D) Activation/proliferation responsive genes (Hill et al., 2007) over-expressed (red) or under-represented (blue) are highlighted in 24 hours versus 0 hour for PLN and pancreas (left panel) and 15 hours versus 0 hour for PLN and pancreas (right panel). (E) CD4 T cells were stained for early activation marker CD69 at different time-points after DT from pancreas and PLN, from BDC2.5/NOD.Foxp3DTR+ (filled symbols) and BDC2.5/NOD.Foxp3DTR− control mice (open symbols). (F) BrdU staining of CD4 T effector cells: BrdU was injected 48 hours after DT and mice were analyzed after one hour. Pancreas and PLN from BDC2.5/NOD.Foxp3DTR+ or DTR negative control mice were stained for BrdU and CD4. Left panel shows representative dot plots, right panel summarized 4–5 mice from independent experiments with mean and SD, * indicates significant difference (p<0.05).
Fig. 3
Fig. 3. Molecular changes after Treg cell ablation
(A) Fold-change vs. expression value plot for 24 hours versus 0 hour (left panel) and 15 hours versus 0 hour (right panel) for the pancreas. Some over-expressed genes highlighted. (B and C) Cytokine expression of CD4 T cells from pancreas and PLN, 48 hours after DT injection from BDC2.5/NOD.Foxp3DTR+ or DTR negative control mice. (B) IFN-γ, (c) IL-17. (C and D) upper panel: dot plots, lower panel: summary of 4 mice per group with mean and SD, * indicates significant difference (p<0.05).
Fig. 4
Fig. 4. Induction of IFN-γ expression is an early, predominant response after punctual Treg cell depletion
(A) CD4 T cells were isolated from pancreas at three different time-points: 0, 15 and 24 hours after DT treatment from BDC2.5/NOD.Foxp3DTR+ mice. (i–iv) P-value vs. fold-change (FC) “volcano” plot for the pancreas CD4+ Teff population at 24 and 15 hours after DT treatment. IFN-γ responsive genes (i–ii), or TGF-β responsive transcripts (iii–iv), either up-regulated (red) or down-regulated (blue) by the respective cytokine were highlighted. P-values presented within the graphs (i–iv) were calculated (χ2 analysis) based on the number of genes dropping to the left or right side of the FC distribution (color indicate up-regulated (red) or down-regulated (blue) genes). Red or blue digits in the upper corner of each plot indicate the number of genes on each side of the distribution. (i, iii) at 24 hours, (ii, iv) at 15 hours. (B) Upper panel: Log2 delta expression values of (15 hours – 0 hours) and (24 hours – 0 hours) for genes from three different signatures: IFN-γ (red), activation/proliferation (blue), and TGF-β (black). Lower panel: IFN-γ expression in CD4+ Teff cells isolated from the pancreas at 0, 15 and 24 hr after DT. (C) Quantitative PCR for IFN-γ expression. CD4, NK, and CD8 cells were isolated from spleen, pancreas and PLN from BDC2.5/NOD.Foxp3DTR+ or DTR negative control mice at different time-points (15, 20, 24 hours) after DT injection. Data are expressed as arbitrary units (AU), the mean and SD from 4 independent experiments are shown
Fig. 5
Fig. 5. The loss of Treg cell control triggers NK-cell activation within the autoimmune lesion
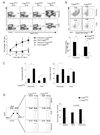
(A) Accumulation of NK cells in autoimmune lesion. NK cells were identified as CD19CD3CD49b+ in lymphocyte gate. Presence of NK cells was followed in BDC2.5/NOD.Foxp3DTR+ or DTR negative control mice 15, 20, 24 and, 48 hours after DT application in pancreas and PLN. Upper panel: representative dot plots are shown. Lower panel: mean and SD of 4–6 independent experiments per group and time point are presented. (B) BrdU incorporation (as described in the legend to Fig. 2F). Upper panel shows representative dot plots, lower panel summarized 4–5 mice from independent experiments with mean and SD, * indicates significant difference (p<0.05). (C) Quantitative PCR data for granzyme B (left panel) and granzyme A (right panel) expression in NK cells, isolated from pancreas and PLN from BDC2.5/NOD.Foxp3DTR+ or DTR-negative littermate-control mice at 24 hours after DT injection. Data are expressed as arbitrary units (AU). The mean and SD from 3–4 independent experiments are shown. * indicates a significant difference (p<0.05). (D) In vivo NK cell cytotoxicity assay. DTR-positive or DTR-negative BDC2.5/NOD mice were depleted of Tregs two days before injection of a mix of splenocyte populations (CFSElo MHCI-negative targets and CFSEhi MHCI-positive controls); sixteen hours later, NK cell activity was measured by comparing the ratio of the two populations in spleen, PLN and pancreas. Left panel: representative dot plots. Right panel, summarizes 3 independent experiments with mean and SD. NK cell kill was significant different in all organs (DTR+ vs. DTR−). Significant difference (P=0.0349) between PLN and pancreas in the DTR positive group.
Fig. 6
Fig. 6. IFN-γ drives the autoimmune response provoked by Treg cell removal
(A–C) BDC2.5/NOD.Foxp3DTR+ or DTR negative control mice were treated with DT and, injected with anti-IFN-γ or control rat Ig (0.5mg). Cells were isolated 24 hours after treatment from pancreas and PLN. (A) Decreased NK cell accumulation in anti-IFN-γ treated group. Summary of 4 mice per group and organ with mean and SD, * indicates significant difference (p<0.05). (B) Quantitative PCR data from NK, CD4 and CD8 cell for IFN-γ expression. Data are expressed as arbitrary units (AU), one representative experiment out of two is shown. (C) Quantitative PCR data for IL-17, IL-21, and IL-22 from CD4 T cells isolated from pancreas and PLN. Data are expressed as arbitrary units (AU), one representative experiment out of two is shown. (D) Diabetes incidence of BDC2.5/NOD.Foxp3DTR+ and DTR- control animals after DT treatment as described in the method section. Foxp3DTR+ group was split into anti-IFN-γ or control rat Ig (1 mg) treated set. 7–8 mice per group and treatment are displayed. P-value was calculated with log-rank test for survival curves. Arrows indicate days of antibody injection.
Fig. 7
Fig. 7. NK cells directly influence CD4+ T cell activation after Treg cell removal
BDC2.5/NOD.Foxp3DTR line was crossed with NK1.1-congenic NOD mice and anti-NK1.1 mAb (0.5 mg) was injected to efficiently deplete NK cells in these NK1.1+ mice. Shown data are derived from the pancreas. (A) Accumulation of NK cells in autoimmune lesion and NK cell depletion efficiency. Presence of NK cells was followed in BDC2.5/NOD.Foxp3DTR+ or DTR negative control mice 24 hours after DT application in pancreas; anti-NK1.1 represents the anti-NK1.1 treated group, crtl represents control group. Left panel: representative dot plots are shown. Right panel: mean and SD of 4–5 mice per group are presented. (B) Quantitative PCR data from CD4 and NK cell for IFN-γ and granzyme B (Gzmb) expression isolated from the pancreas and described in (A). Each dot represents an individual mouse. (C) Quantitative PCR data from CD4 cell for IFN-γ and granzyme B (Gzmb) expression are plotted against the percentage of NK cells in the pancreas. P-values and R2 were calculated. Each dot represents an individual mouse.

References

    1. Alba A, Planas R, Clemente X, Carrillo J, Ampudia R, Puertas MC, Pastor X, Tolosa E, Pujol-Borrell R, Verdaguer J, et al. Natural killer cells are required for accelerated type 1 diabetes driven by interferon-beta. Clin Exp Immunol. 2008 - PMC - PubMed
    1. Bennett CL, Christie J, Ramsdell F, Brunkow ME, Ferguson PJ, Whitesell L, Kelly TE, Saulsbury FT, Chance PF, Ochs HD. The immune dysregulation, polyendocrinopathy, enteropathy, X-linked syndrome (IPEX) is caused by mutations of FOXP3. Nat. Genet. 2001;27:2021. - PubMed
    1. Bennett CL, Clausen BE. DC ablation in mice: promises, pitfalls, and challenges. Trends Immunol. 2007;28:525–531. - PubMed
    1. Bour-Jordan H, Salomon BL, Thompson HL, Szot GL, Bernhard MR, Bluestone JA. Costimulation controls diabetes by altering the balance of pathogenic and regulatory T cells. J Clin Invest. 2004;114:979–987. - PMC - PubMed
    1. Carnaud C, Gombert J, Donnars O, Garchon H, Herbelin A. Protection against diabetes and improved NK/NKT cell performance in NOD.NK1.1 mice congenic at the NK complex. J. Immunol. 2001;166:2404–2411. - PubMed

Publication types

MeSH terms

Substances