. 2009 Dec;137(6):2030-2040.e5.
doi: 10.1053/j.gastro.2009.07.078. Epub 2009 Oct 8.

Protection of epithelial barrier function by the Crohn's disease associated gene protein tyrosine phosphatase n2

Affiliations

Protection of epithelial barrier function by the Crohn's disease associated gene protein tyrosine phosphatase n2

Michael Scharl et al. Gastroenterology. 2009 Dec.

Abstract

Background & aims: Protein tyrosine phosphatase N2 (PTPN2) has been identified as a Crohn's disease (CD) candidate gene. However, a role for PTPN2 in the pathogenesis of CD has not been identified. Increased permeability of the intestinal epithelium is believed to contribute prominently to CD. The aim of this study was to determine a possible role for PTPN2 in CD pathogenesis.

Methods: Intestinal epithelial cell (IEC) lines T(84) and HT29cl.19a were used in all studies. Protein analysis was performed by Western blotting, and protein knockdown was induced by small interfering RNA. Primary samples were from control and CD patients.

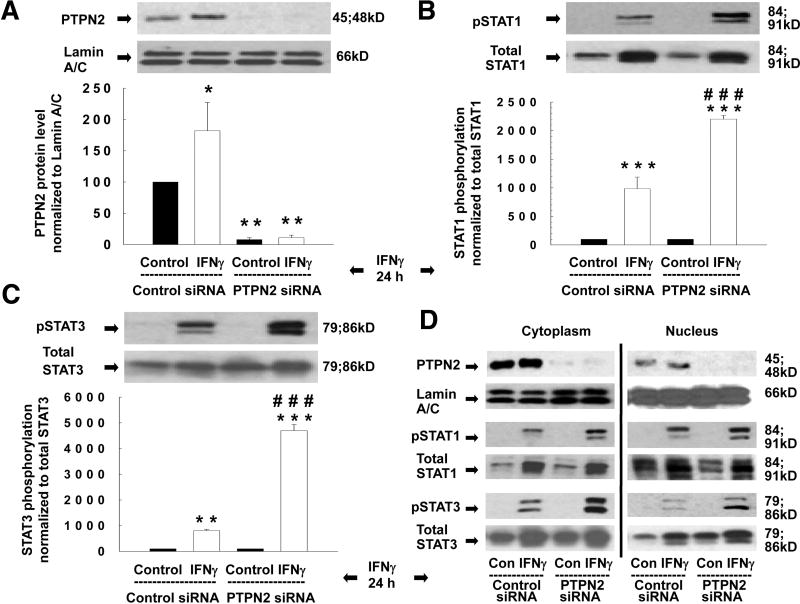
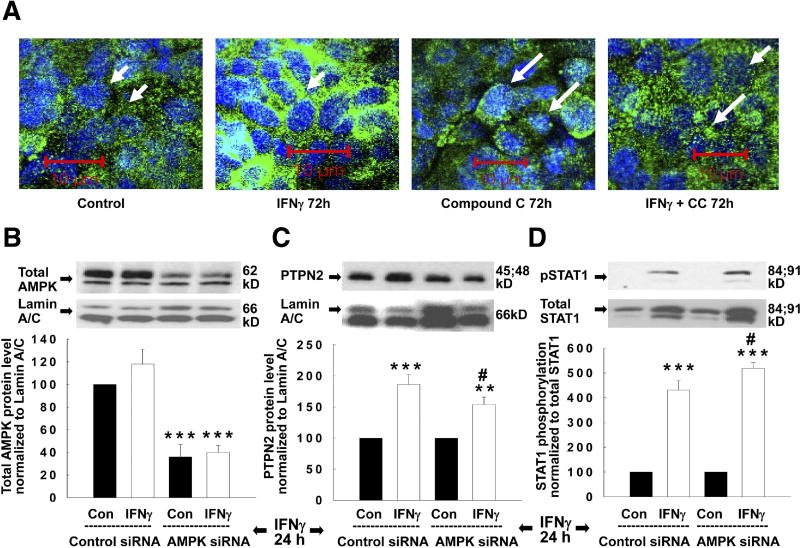
Results: Here, we demonstrate increased PTPN2 expression in CD intestinal biopsy specimens and that the proinflammatory cytokine interferon (IFN)-gamma increases PTPN2 expression and activity in IEC. Moreover, IFN-gamma-induced STAT1 and STAT3 phosphorylation in IEC is enhanced by PTPN2 knockdown. The cellular energy sensor adenosine monophosphate-activated protein kinase partially regulates the IFN-gamma-induced effects on PTPN2. Additionally, PTPN2 knockdown potentiates IFN-gamma-induced increases in epithelial permeability, accompanied by elevated expression of the pore-forming protein claudin-2.

Conclusions: PTPN2 is activated by IFN-gamma and limits IFN-gamma-induced signalling and consequent barrier defects. These data suggest a functional role for PTPN2 in maintaining the intestinal epithelial barrier and in the pathophysiology of CD.


Conflict of interest statement

The authors declare that they have no competing financial interests.

Figures

Figure 1
Figure 1
IFNγ increases PTPN2 levels in T84 cells and human colonic biopsy specimens. (a) IFNγ-stimulated PTPN2 mRNA expression normalized to GAPDH (n=3, performed in triplicate). (b) Cytoplasmic PTPN2 protein in IFNγ-treated T84 cells shown by representative Western blots. Lamin A/C was used throughout as a loading control. The relative protein level was assessed by densitometry (n=4). (c) Nuclear PTPN2 protein in IFNγ-treated T84 cells is demonstrated by representative Western blots and densitometry (n=4). Data are expressed as a percentage of the respective control. (d) PTPN2 mRNA in human terminal ileum and colon biopsies from CD patients with active disease (n=9) and in remission (n=7) as well as from control subjects (n=9). PTPN2 mRNA expression was normalized to the housekeeping gene GAPDH. Measurements were performed in triplicate. Asterisks denote significant differences from the respective control (*=p<0.05, **=p<0.01, ***=p<0.001).
Figure 2
Figure 2
Elevated PTPN2 activity parallels decreased STAT phosphorylation in IFNγ-treated T84 cells. (a) PTPN2 was immunoprecipitated from whole cell lysates. Blots were probed for PTPN2 to show equivalent protein loading. The graph demonstrates IFNγ-stimulated PTPN2 activity (n=4). (b) Representative Western blots show phosphorylated cytoplasmic (Tyr701, above) and total STAT1 (below) after IFNγ treatment, followed by densitometric analysis (n=5). (c) Western blots and densitometry showing phosphorylated nuclear (above) and total STAT1 (below) in IFNγ-treated cells (n=5). (d) Phosphorylated cytoplasmic (Tyr705) and total STAT3 in IFNγ-treated T84 cells shown by representative Western blots and densitometry (n=4). Data in (b), (c) and (d) are shown as a percentage of the respective control. Asterisks indicate significant differences compared to the respective control (*=p<0.05, **=p<0.01, ***=p<0.001). #=p<0.05; ###=p<0.001 vs. 24 h IFNγ treatment.
Figure 3
Figure 3
PTPN2 knock-down enhances IFNγ-stimulated STAT1+3 phosphorylation. T84 cells were transfected with either non-specific or PTPN2 siRNA and treated with IFNγ (24h). (a) Representative Western blots for PTPN2 and lamin A/C followed by densitometric analysis (n=3). (b,c) Representative Western blots and densitometry showing STAT1+3 phosphorylation and expression (n=3). Figures (a) to (c) represent analyses of whole cell lysates. Asterisks indicate significant differences vs. the respective control (*=p<0.05, **=p<0.01, ***=p<0.001). ###=p<0.001 vs. 24 h IFNγ treatment of control siRNA-transfected cells. (d) Representative Western blots showing PTPN2 and lamin A/C, STAT1+3 expression and phosphorylation, in cytoplasmic and nuclear lysates (n=2).
Figure 4
Figure 4
AMPK activation by IFNγ and regulation of STAT1 phosphorylation in T84 cells. (a) Western blots and densitometric analysis of phosphorylated and total AMPK after IFNγ treatment (n=3-7). (b) Western blots and densitometric analysis of phosphorylated and total AMPK after IFNγ and/or CC (50 μM, bilaterally) (n=5). Western blots and densitometric analysis of (c) cytoplasmic (n=4), (d) nuclear PTPN2 (n=3), (e) cytoplasmic (n=4) and (f) nuclear (n=4) phosphorylated and total STAT1 in response to IFNγ (72h). Black dashes in (c) to (f) indicate the gel has been cropped at this position. Asterisks indicate significant differences vs. the respective control (*=p<0.05, **=p<0.01, ***=p<0.001). ++=p<0.01 vs. 6h IFNγ treatment and #=p<0.05 vs. 72h IFNγ.
Figure 5
Figure 5
Effect of AMPK knock-down on PTPN2 distribution. (a) Confocal microscopy shows PTPN2 (green) in T84 cells. Nuclear staining is blue. Each panel shows a representative image for one experiment. Three experiments were performed for each condition. PTPN2 was equally distributed between the nucleus (arrow) and cytoplasm in control cells. Cytoplasmic PTPN2 accumulates (arrow) in response to IFNγ treatment (72h). Compound C had no effect on PTPN2 distribution vs. control cells. However, CC prevented the IFNγ-stimulated nuclear exit of PTPN2 (arrows). (b) Representative Western blots show AMPKα levels in 24 h IFNγ-treated T84 cells transfected with either control or AMPKα1 siRNA and densitometric analysis (n=4). (c) PTPN2 and lamin A/C expression (n=4). (d) Representative Western blots and densitometric analysis of phosphorylated and total STAT1 (n=4). Asterisks indicate significant differences vs. the respective control (**=p<0.01, ***=p<0.001). #=p<0.05 vs. 72h IFNγ treatment of control siRNA cells.
Figure 6
Figure 6
FITC-dextran flux, TER and claudin-2 protein in PTPN2-deficient T84 cells. (a,b) Western blots showing decreased PTPN2 but not lamin A/C protein in PTPN2-deficient T84 cells after IFNγ (72 h) treatment. (a) FITC-dextran flux (n=3); (b) TER (n=3); (c) Western blot and densitometric analysis of claudin-2 expression (n=3); and (d) expression of the tight junction proteins claudin-4, occludin and ZO-1 (n=3); in control or PTPN2 siRNA-transfected cells in response to IFNγ. Asterisks indicate significant differences vs. the respective control (*=p<0.05, ***=p<0.001). #=p<0.05, ###=p<0.001 vs. 72h IFNγ treatment of control siRNA cells.

References

    1. Tonks NK, Neel BG. Combinatorial control of the specificity of protein tyrosine phosphatases. Curr Opin Cell Biol. 2001;13:182–195. - PubMed
    1. Franke A, Balschun T, Karlsen TH, Hedderich J, May S, Lu T, Schuldt D, Nikolaus S, Rosenstiel P, Krawczak M, Schreiber S. Replication of signals from recent studies of Crohn’s disease identifies previously unknown disease loci for ulcerative colitis. Nat Genet. 2008 - PubMed
    1. Parkes M, Barrett JC, Prescott NJ, Tremelling M, Anderson CA, Fisher SA, Roberts RG, Nimmo ER, Cummings FR, Soars D, Drummond H, Lees CW, Khawaja SA, Bagnall R, Burke DA, Todhunter CE, Ahmad T, Onnie CM, McArdle W, Strachan D, Bethel G, Bryan C, Lewis CM, Deloukas P, Forbes A, Sanderson J, Jewell DP, Satsangi J, Mansfield JC, Cardon L, Mathew CG. Sequence variants in the autophagy gene IRGM and multiple other replicating loci contribute to Crohn’s disease susceptibility. Nat Genet. 2007;39:830–832. - PMC - PubMed
    1. Fisher SA, Tremelling M, Anderson CA, Gwilliam R, Bumpstead S, Prescott NJ, Nimmo ER, Massey D, Berzuini C, Johnson C, Barrett JC, Cummings FR, Drummond H, Lees CW, Onnie CM, Hanson CE, Blaszczyk K, Inouye M, Ewels P, Ravindrarajah R, Keniry A, Hunt S, Carter M, Watkins N, Ouwehand W, Lewis CM, Cardon L, Lobo A, Forbes A, Sanderson J, Jewell DP, Mansfield JC, Deloukas P, Mathew CG, Parkes M, Satsangi J. Genetic determinants of ulcerative colitis include the ECM1 locus and five loci implicated in Crohn’s disease. Nat Genet. 2008 - PMC - PubMed
    1. The Welcome Trust Case Control Consortium. Genome-wide association study of 14,000 cases of seven common diseases and 3,000 shared controls. Nature. 2007;447:661–678. - PMC - PubMed

Publication types

MeSH terms