. 2010 Feb 1;49(3):2457-66.
doi: 10.1016/j.neuroimage.2009.09.062. Epub 2009 Oct 8.

The optimal template effect in hippocampus studies of diseased populations

Affiliations

The optimal template effect in hippocampus studies of diseased populations

Brian B Avants et al. Neuroimage. .

Abstract

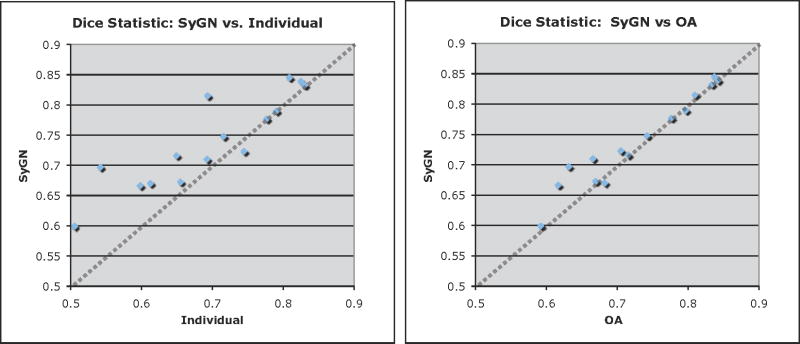
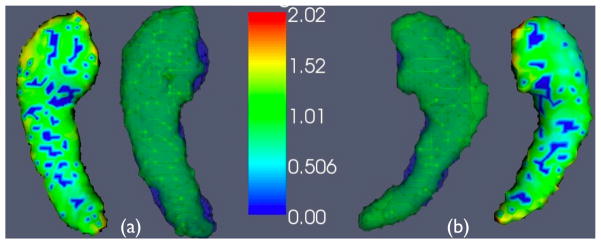
We evaluate the impact of template choice on template-based segmentation of the hippocampus in epilepsy. Four dataset-specific strategies are quantitatively contrasted: the "closest to average" individual template, the average shape version of the closest to average template, a best appearance template and the best appearance and shape template proposed here and implemented in the open source toolkit Advanced Normalization Tools (ANTS). The cross-correlation similarity metric drives the correspondence model and is used consistently to determine the optimal appearance. Minimum shape distance in the diffeomorphic space determines optimal shape. Our evaluation results show that, with respect to gold-standard manual labeling of hippocampi in epilepsy, optimal shape and appearance template construction outperforms the other strategies for gaining data-derived templates. Our results also show the improvement is most significant on the diseased side and insignificant on the healthy side. Thus, the importance of the template increases when used to study pathology and may be less critical for normal control studies. Furthermore, explicit geometric optimization of the shape component of the unbiased template positively impacts the study of diseased hippocampi.


Figures

Figure 1
Figure 1
The SyGN template healthy side hippocampus is in (a), while the SyGN template diseased side hippocampus is in (b). The optimal appearance template healthy side hippocampus is in (c), while its diseased side hippocampus is in (d). The individual shape-optimal template healthy side is in (e), while its diseased side is in (f). The individual template healthy side hippocampus is in (g), while the diseased side hippocampus is in (h). The template in (e) and (f) is derived from the image shown in (g) and (h). All of these templates show the asymmetric effect of unilateral sclerosis on temporal lobe neuroanatomy.
Figure 2
Figure 2
We illustrate two steps in our optimization of a population template through a symmetric diffeomorphic parameterization. The shape of an initial template guess (orange circle) is updated by first estimating the diffeomorphic paths, φi. We then change the initial conditions, ψ, to the maps between the template, Ī, and the individual images, Ji, to shorten their total length. The template shape also changes under ψ. We term this approach “symmetric” because it uses symmetric pairwise mapping, symmetrically optimizes the two terms in normalization methods (geometry and appearance) across the population and is unbiased, that is, does not prefer any specific image or require user input.
Figure 3
Figure 3
Above, in (a), we see four binary images, ellipses, in a synthetic dataset with known radii, R1 and R2 and identical center. The unbiased template optimization initializes the template appearance by averaging these images, given the image in the upper right, (b), which has four gray levels, 0, 0.25, 0.5, 0.75 and 1. The geometric ground truth is shown in (c). The SyGN algorithm result, in (d), converges—up to interpolation error—to the expected shape and appearance. Error between SyGN and the ground truth is shown in (g). If the shape update step is removed—and we use only an optimal appearance (OA) template–the algorithm converges to a result with the wrong shape, shown in (e) and (f). The implication is that methods without explicit shape optimization will be more sensitive to initialization and are thus less likely to find the optimal minimum shape distance image. Theoretically, methods such as congealing (Learned-Miller, 2006) and (Joshi et al., September 2004), neither of which use explicit shape optimization, would converge to this type of reasonable, but geometrically less than optimal, solution. This is because the optimal solution for the problem above, with a matching criterion related to intensity difference, is to map all images to the 0.5 level set of the initial image shown in (b).
Figure 4
Figure 4
The SyGN optimal template image, derived from (a) through (e) in the top row, is in (l). The Euclidean mean of images (a) through (e) is in (f). The gradient update XJi is in (g) through (k). The SyGN image appearance—derived from maximizing the template appearance with respect to correlation—has more contrast and better captures the eyebrows than the Euclidean average, thus providing more realistic features to guide mapping. This data is available in ANTS, along with scripts to compute this example (Avants et al., 2009). We use face images to illustrate the concepts due to their ease of interpret-ability and familiarity in comparison to brain images. Furthermore, faces have biological variability and detailed features (such as mustache) that may not match perfectly between subjects. Similar challenges to correspondence are also present in brain mapping.
Figure 5
Figure 5
We contrast the performance of OA vs SyGN and Indi vs SyGN, for segmenting the diseased-side hippocampus, by graphing their relative values. Identical performance would fall along the dotted line. SyGN, relatively, performs notably better—on nearly all data—than the individual template. SyGN’s performance is comparable to the OA template except on a few individuals where SyGN’s overlap ratio is superior by approximately 0.05.
Figure 6
Figure 6
The average SyGN template hippocampi are shown with (a), the healthy side mean surface distances, and (b) the diseased side mean surface distances. An individual that is near the average performance for both sides is also shown (in blue) overlaid in order to visualize the expected performance. Note the asymmetry in the expected size of the diseased versus healthy side hippocampus.

References

    1. Arnold VI. Ordinary Differential Equations. Springer-Verlag; Berlin: 1991.
    1. Ashburner J, Czernansky J, Davatzikos C, Fox N, Frisoni G, Thompson P. Computer-assisted imaging to assess brain structure in healthy and diseased brains. Lancet Neurology. 2003 February;2:79–88. - PubMed
    1. Ashburner J, Friston KJ. Computing average shaped tissue probability templates. Neuroimage. 2009 Apr;45 (2):333–341. - PubMed
    1. Ashburner J, Hutton C, Frackowiak R, IJohnsrude CP, Friston K. Identifying global anatomical differences: Deformation-based morphometry. Hum Brain Mapp. 1998;6:348–357. - PMC - PubMed
    1. Avants B, Epstein CL, Gee JC. Geodesic image normalization in the space of diffeomorphisms. Mathematical Foundations of Computational Anatomy. 2006:125–133.

Publication types