. 2009 Dec;151(4):1977-90.
doi: 10.1104/pp.109.136952. Epub 2009 Oct 9.

Identification of defense compounds in Barbarea vulgaris against the herbivore Phyllotreta nemorum by an ecometabolomic approach

Affiliations

Identification of defense compounds in Barbarea vulgaris against the herbivore Phyllotreta nemorum by an ecometabolomic approach

Vera Kuzina et al. Plant Physiol. 2009 Dec.

Abstract

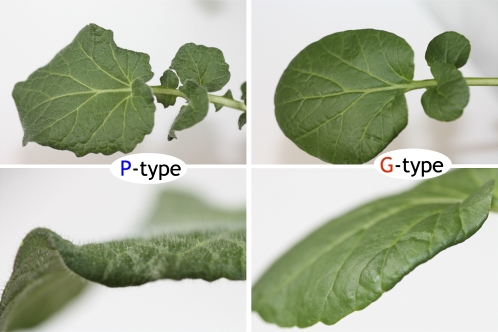
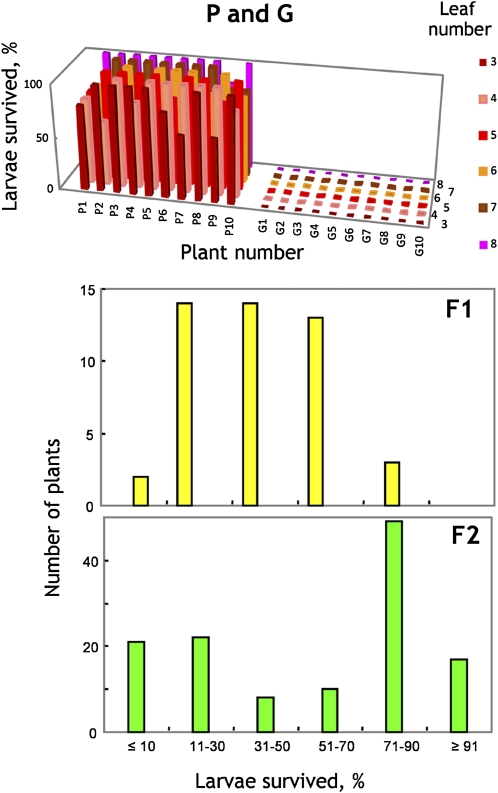
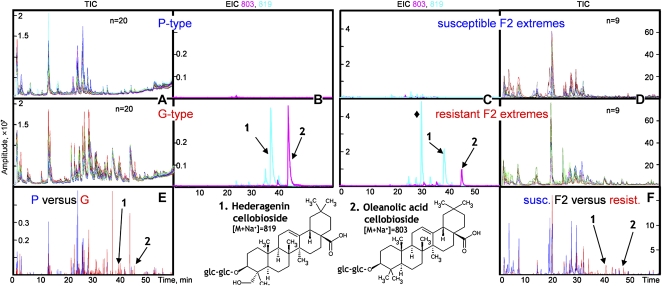
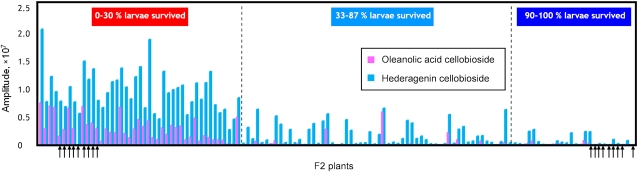
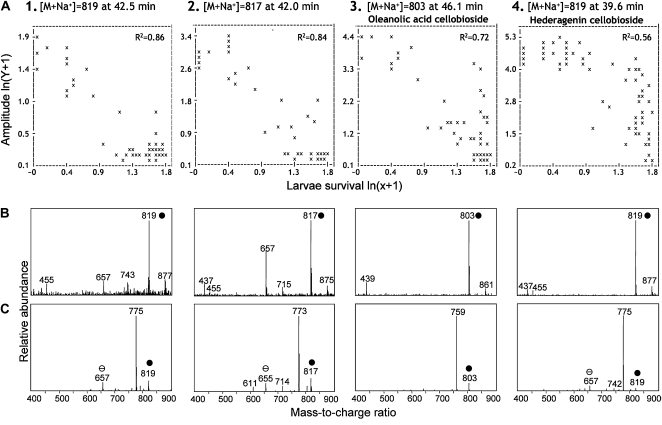
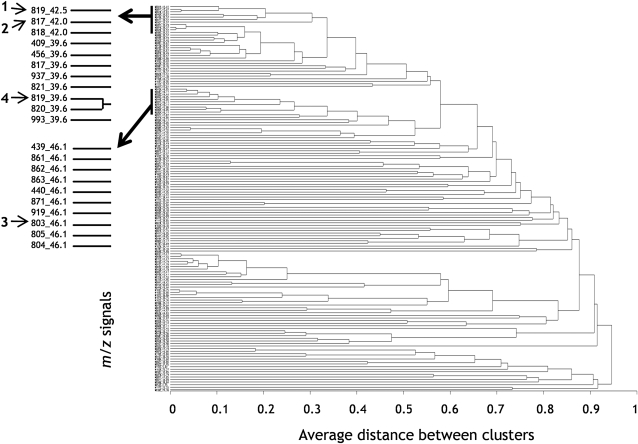
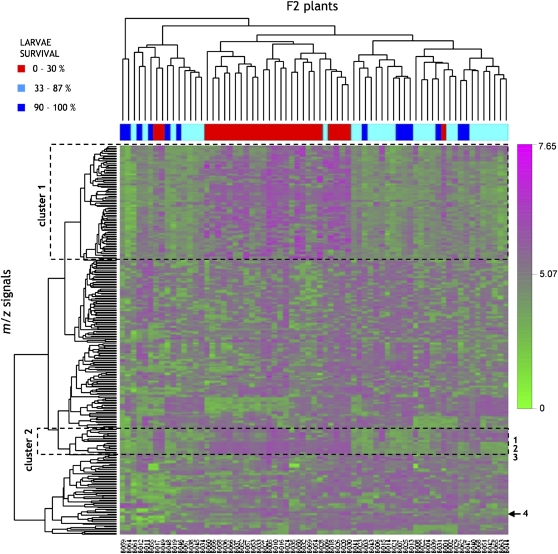
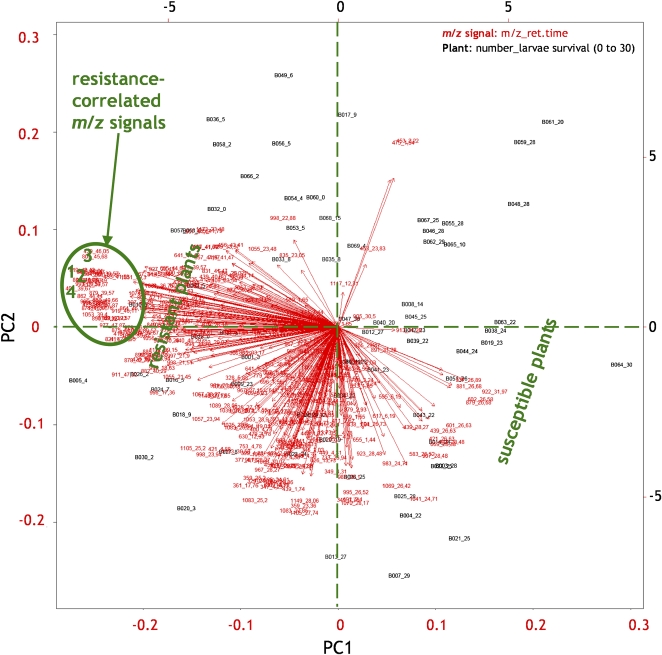
Winter cress (Barbarea vulgaris) is resistant to a range of insect species. Some B. vulgaris genotypes are resistant, whereas others are susceptible, to herbivory by flea beetle larvae (Phyllotreta nemorum). Metabolites involved in resistance to herbivory by flea beetles were identified using an ecometabolomic approach. An F2 population representing the whole range from full susceptibility to full resistance to flea beetle larvae was generated by a cross between a susceptible and a resistant B. vulgaris plant. This F2 offspring was evaluated with a bioassay measuring the ability of susceptible flea beetle larvae to survive on each plant. Metabolites that correlated negatively with larvae survival were identified through correlation, cluster, and principal component analyses. Two main clusters of metabolites that correlate negatively with larvae survival were identified. Principal component analysis grouped resistant and susceptible plants as well as correlated metabolites. Known saponins, such as hederagenin cellobioside and oleanolic acid cellobioside, as well as two other saponins correlated significantly with plant resistance. This study shows the potential of metabolomics to identify bioactive compounds involved in plant defense.


Figures

Figure 1.
Figure 1.
Rosette leaves of P- and G-types of B. vulgaris subspecies arcuata. The P-type has hairs, while the G-type does not.
Figure 2.
Figure 2.
Survival of flea beetle larvae on 10 individual parental P-type (P1–P10) and G-type (G1–G10), F1, and F2 B. vulgaris plants. Each leaf (nos. three to eight) of an individual plant was incubated with five flea beetle larvae for 3 d. Twenty-eight percent of larvae survived on the F1 plant used to generate the F2 population.
Figure 3.
Figure 3.
Metabolite profiling of B. vulgaris by LC-MS. A and D, Overlapped total ion chromatograms (TIC) of 20 P-type and 20 G-type plants (A) and of the nine most susceptible and nine most resistant F2 extremes (D). B and C, Extracted ion chromatograms (EIC) of m/z 803 (in pink; [M+Na]+ for oleanolic acid cellobioside) and m/z 819 (in cyan; [M+Na]+ for hederagenin cellobioside) of a P-type and a G-type (B) and susceptible and resistant F2 extremes (C). E and F, Example of a baseline-corrected and normalized profile of a P-type (marked in blue) versus a G-type (marked in red; E) and of susceptible (marked in blue) and resistant (marked in red) F2 extremes (F).
Figure 4.
Figure 4.
Differential retention display of F2 plant data sets (A and B) and P and G data sets aligned separately or together, generated by MetAlign, which shows differences in retention between all files referenced with regard to the first data set in the group. When two data sets are aligned together, blue and red points are from data sets of group 1 (P-type) and group 2 (G-type), respectively. Black lines represent “prealign estimates” of retention differences (=final shift correction profiles) between the data sets and data set 1 of group 1. These prealign estimates are calculated by interpolation and extrapolation using prealign calibration points (black points). Prealign calibration points were calculated from chromatographic peaks adhering to restriction parameters of the alignment options and criteria that were selected.
Figure 5.
Figure 5.
Distribution of hederagenin cellobioside and oleanolic acid cellobioside in 127 F2 plants with different resistance to flea beetle larvae. Intensities of [M+Na]+ for the two compounds (m/z 819 for hederagenin cellobioside and m/z 803 for oleanolic acid cellobioside) were used. The resistant and susceptible extremes used in the alignment of the LC-MS profiles by MetAlign are marked by arrows.
Figure 6.
Figure 6.
The m/z signals most negatively correlated with flea beetle larvae survival, and their MS and MS/MS spectra. Each column represents one of the four compounds, most negatively correlated with the larvae survival. A, Correlation between ion intensity and larvae survival. Each plant is represented by an x. B, MS spectra of compounds 1 to 4 (chromatographic peaks at 42.5, 42.0, 46.1, and 39.6 min, respectively). C, MS/MS spectra showing fragmentation patterns of the base peaks of the four compounds: m/z 819, 817, 803, and 819, respectively. M/z 803 (compound 3) and 819 (compound 4) correspond to sodium adduct ions of oleanolic acid cellobioside and hederagenin cellobioside, respectively; m/z 819 (compound 1) is likely to correspond to a saponin with a structure similar to hederagenin cellobioside; m/z 817 (compound 2) is likely to correspond to the sodium adduct ion of hederagenin cellobioside or its isomer or to a saponin with a similar structure with an additional double bond in the aglycone. Loss of m/z 44 reflects the loss of a carboxylic group, and loss of m/z 160 reflects the loss of a glycose moiety. Thus, m/z 655 and 657 correspond to the monoglucosides; m/z 611 corresponds to the monoglycoside by cleaving of a carboxylic group; m/z 775, 773, and 759 correspond to the corresponding cellobioside by cleaving of a carboxylic group; m/z 714 corresponds to the monoglucoside minus Na2Cl; and m/z 742 corresponds to the cellobioside minus Na2Cl and water. For m/z, white circles correspond to monoglucoside and black circles correspond to cellobioside.
Figure 7.
Figure 7.
UPGMA dendrogram relating the 150 m/z signals of the F2 offspring most correlated with larvae survival. The m/z signals are represented by their m/z values followed by retention times. Base peaks of compounds 1 to 4 are as in Figure 6.
Figure 8.
Figure 8.
Heat map for two-way hierarchical clustering of F2 plants and their metabolites (represented as m/z signals). Base peaks of compounds 1 to 4 marked at the right of the heat map are as in Figure 6. Plants are marked with three different colors according to their level of resistance, as in Figure 5. Color scale indicates log10-transformed m/z signal intensities (relative metabolite levels).
Figure 9.
Figure 9.
Relationships between plants and metabolites (represented as m/z signals) identified by PCA. Red arrows represent m/z signals; the metabolites are represented by m/z values followed by retention times in minutes. Black points represent plants and their resistance toward insects; the letter B corresponds to data that are derived from data set B, followed by the plant line, and the larvae survival number out of 30 larvae is indicated after the underscore. Directions of arrows show the relative loadings of the metabolites on the first and second PCs. Base peaks of compounds 1 to 4 are as in Figure 6.

References

    1. Agerbirk N, Olsen CE, Bibby BM, Frandsen HO, Brown LD, Nielsen JK, Renwick JAA (2003. a) A saponin correlated with variable resistance of Barbarea vulgaris to diamondback moth Plutella xylostella. J Chem Ecol 29 1417–1433 - PubMed
    1. Agerbirk N, Olsen CE, Nielsen JK (2001) Seasonal variation in leaf glucosinolates and insect resistance in two types of Barbarea vulgaris ssp. arcuata. Phytochemistry 58 91–100 - PubMed
    1. Agerbirk N, Ørgaard M, Nielsen JK (2003. b) Glucosinolates, flea beetle resistance, and leaf pubescence as taxonomic characters in the genus Barbarea (Brassicaceae). Phytochemistry 63 69–80 - PubMed
    1. Bailey CD, Koch MA, Mayer M, Mummenhoff K, O'Kane SL Jr, Warwick SI, Windham MD, Al-Shehbaz IA (2006) Toward a global phylogeny of the Brassicaceae. Mol Biol Evol 23 2142–2160 - PubMed
    1. Blow N (2008) Metabolomics: biochemistry's new look. Nature 455 697–700 - PubMed

Publication types

LinkOut - more resources