. 2009 Dec;23(12):1990-9.
doi: 10.1210/me.2009-0296. Epub 2009 Oct 9.

Mice deficient for glucagon gene-derived peptides display normoglycemia and hyperplasia of islet {alpha}-cells but not of intestinal L-cells

Affiliations

Mice deficient for glucagon gene-derived peptides display normoglycemia and hyperplasia of islet {alpha}-cells but not of intestinal L-cells

Yoshitaka Hayashi et al. Mol Endocrinol. 2009 Dec.

Abstract

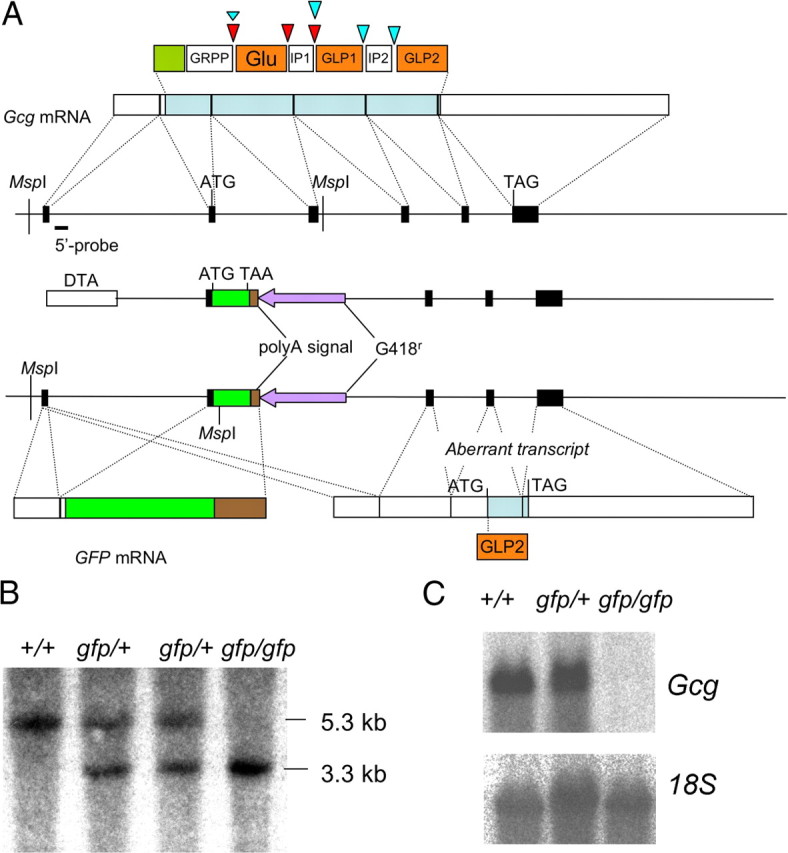
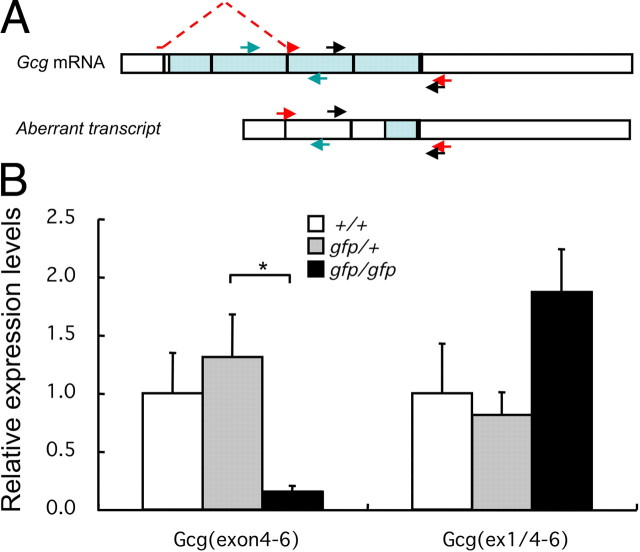
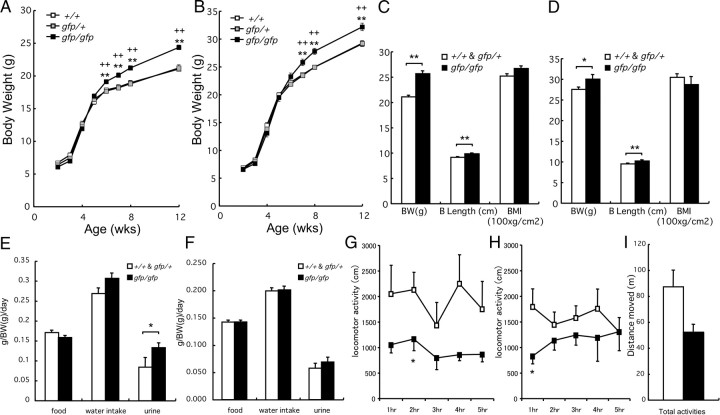
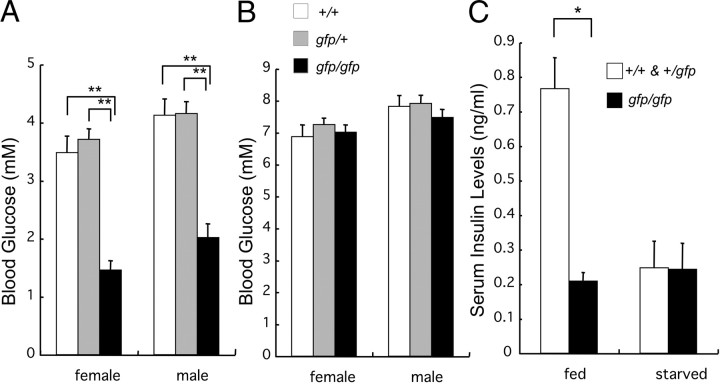
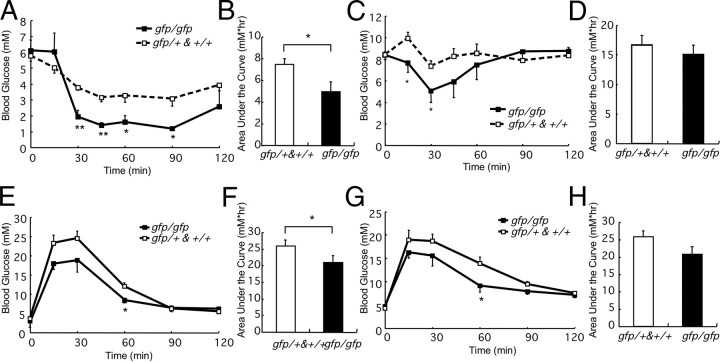
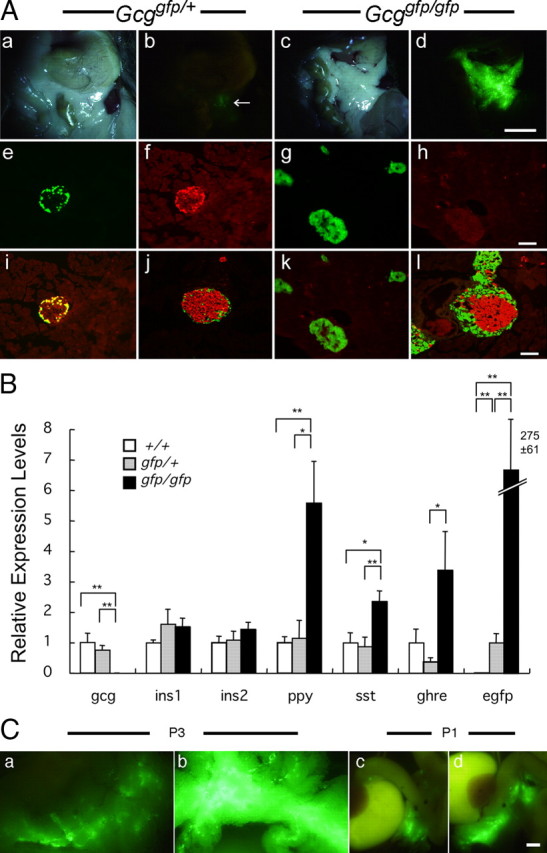
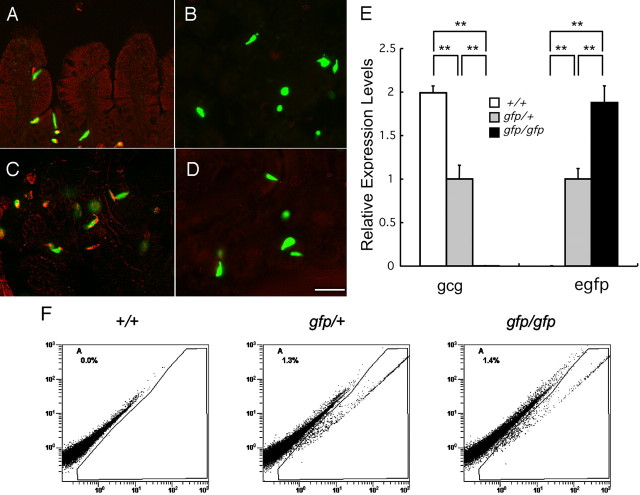
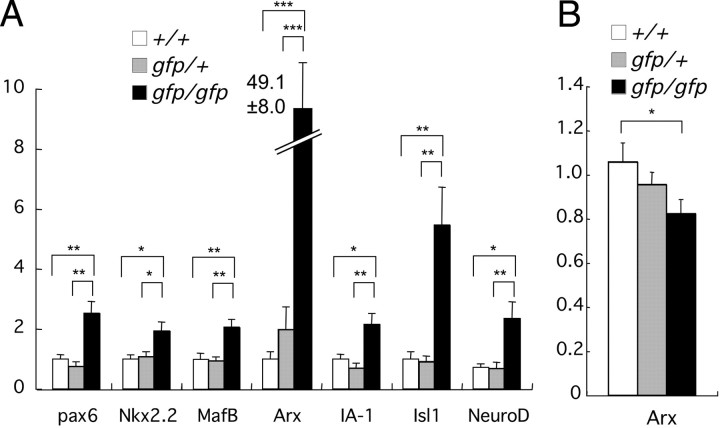
Multiple bioactive peptides, including glucagon, glucagon-like peptide-1 (GLP-1), and GLP-2, are derived from the glucagon gene (Gcg). In the present study, we disrupted Gcg by introduction of GFP cDNA and established a knock-in mouse line. Gcg(gfp/gfp) mice that lack most, if not all, of Gcg-derived peptides were born in an expected Mendelian ratio without gross abnormalities. Gcg(gfp/gfp) mice showed lower blood glucose levels at 2 wk of age, but those in adult Gcg(gfp/gfp) mice were not significantly different from those in Gcg(+/+) and Gcg(gfp/+) mice, even after starvation for 16 h. Serum insulin levels in Gcg(gfp/gfp) mice were lower than in Gcg(+/+) and Gcg(gfp/+) on ad libitum feeding, but no significant differences were observed on starvation. Islet alpha-cells and intestinal L-cells were readily visualized in Gcg(gfp/gfp) and Gcg(gfp/+) mice under fluorescence. The Gcg(gfp/gfp) postnatally developed hyperplasia of islet alpha-cells, whereas the population of intestinal L-cells was not increased. In the Gcg(gfp/gfp), expression of Aristaless-related homeobox (Arx) was markedly increased in pancreas but not in intestine and suggested involvement of Arx in differential regulation of proliferation of Gcg-expressing cells. These results illustrated that Gcg-derived peptides are dispensable for survival and maintaining normoglycemia in adult mice and that Gcg-derived peptides differentially regulate proliferation/differentiation of alpha-cells and L-cells. The present model is useful for analyzing glucose/energy metabolism in the absence of Gcg-derived peptides. It is useful also for analysis of the development, differentiation, and function of Gcg-expressing cells, because such cells are readily visualized by fluorescence in this model.


Figures

Fig. 1.
Fig. 1.
Strategies for gene targeting. A, Schematic representation of pre-proglucagon processing is shown at the top. The signal peptide is indicated in dark green. Cleavage sites for Pcsk2 and Pcsk1 are indicated as red and cyan triangles, respectively. The colored region within the Gcg mRNA indicates the coding region. The MspI sites that resulted in fragments that hybridized to the 5′-probe are indicated. GFP mRNA and trace amounts of aberrant transcripts were transcribed from the disrupted allele. The open reading frame in the aberrant transcripts encoded the C-terminal part of GLP2. Glu, Glucagon; GRPP, glucagon-related polypeptides; IP, intervening peptides. B, Southern blotting. Genomic DNA was digested with MspI and hybridized with the probe indicated in A. C, Northern blotting. Pancreatic total RNA was probed with Gcg or 18S rRNA sequences.
Fig. 2.
Fig. 2.
Analyses for aberrant transcripts. A, Schematic representation of primers used for analyzing Gcg transcript. The structures of the normal Gcg transcript and the aberrant transcripts are depicted, together with the location of the primers. The open reading frame is light blue. Blue primers are primers used for Gcg mRNA quantification in Fig. 6B. Black primers are primers for quantification of Gcg (exon4–6) mRNA. Red primers are primers specific for the aberrant transcripts. B, Expression of aberrant Gcg transcripts in Gcg+/+ (black bars), Gcggfp/+ (gray bars), and Gcggfp/gfp (white bars). n = 6–8. *, P < 0.05. Note that the aberrant transcripts were also detected in Gcg+/+ and Gcggfp/+.
Fig. 3.
Fig. 3.
Growth curve, body mass index, food intake, and locomotor activities in Gcggfp/gfp. A and B, Growth curve of female (A) and male (B) mice. n = 9–20. **, P < 0.01 (vs. Gcg+/+); ++, P < 0.01 (vs. Gcggfp/+). C and D, Body weight (BW), length, and body mass index (BMI) of female (C) and male (D) mice. n = 9–20. *, P < 0.05; **, P < 0.01. E and F, Food and water intake and urine output of female (E) and male (F) mice. G and H, Locomotor activities of female (G) and male (H) mice. n = 6–12. *, P < 0.05. I, Total locomotor activities. n = 12–24.
Fig. 4.
Fig. 4.
Blood glucose levels and serum insulin levels in Gcggfp/gfp mice. A, Blood glucose levels in Gcg+/+ (black bars), Gcggfp/+ (gray bars), and Gcggfp/gfp (white bars) at 2 wk old on ad libitum feeding. B, Blood glucose levels in Gcg+/+ (black bars), Gcggfp/+ (gray bars), and Gcggfp/gfp (white bars) at 2–3 months old on ad libitum feeding. Mean ± sem (n = 11–49). **, P < 10−6 C, Serum insulin levels in Gcggfp/gfp mice. Serum insulin levels in 2- to 3-month-old Gcg+/+ and Gcggfp/+ (black bars) and Gcggfp/gfp (white bars) mice on ad libitum feeding or 16 h starvation are shown. Mean ± sem (n = 3–14). *, P < 0.01.
Fig. 5.
Fig. 5.
Glucose homeostasis in Gcggfp/gfp mice. A–D, Insulin tolerance tests; E–H, IPGTT were performed using female (A, B, E, and F) or male (C, D, G, and H) mice. □, Gcg+/+ and Gcg+/gfp (n = 8–12); ▪, Gcggfp/gfp (n = 3–6). *, P < 0.05; **, P < 0.01.
Fig. 6.
Fig. 6.
Characterization of pancreatic islets in Gcggfp/gfp mice. A, GFP fluorescence in the islets of Gcggfp/+ (a, b, e, f, i, and j) and Gcggfp/gfp (c, d, g, h, k, and l) mice. Photographs (a and c) and fluorescent images (b and d) of abdominal organs of 1-month-old mice are shown. Fluorescence in the pancreas in b is indicated with an arrow. EGFP fluorescence (e and g), glucagon immunostaining (f and h), and merged images (i and k) of the islets are shown. EGFP fluorescence together with insulin staining (red) is shown in j and l. Scale bars, 5 mm (a–d) and 50 μm (e–l). B, Expression of mRNA in the pancreas. White bars, Gcg+/+; gray bars, Gcg+/gfp; black bars, Gcggfp/gfp. *, P < 0.05; **, P < 0.01. C, Pancreas of Gcggfp/+ mice (a and c) or of Gcggfp/gfp mice (b and d) at postnatal d 3 (P3) (a and b) or postnatal d 1 (P1) (c and d). Scale bars, 200 μm.
Fig. 7.
Fig. 7.
Characterization of intestinal L-cells in Gcggfp/gfp mice. A–D, Immunohistochemical analysis of L-cells. Expression of GLP-1 (A and B) and GLP-2 (C and D) was analyzed in Gcggfp/+ (A and C) and Gcggfp/gfp (B and D) mice. Scale bars, 50 μm. E, Expression of Gcg and EGFP mRNA in L-cells. n = 6–8. White bars, Gcg+/+; gray bars, Gcg+/gfp; black bars, Gcggfp/gfp. **, P < 0.01. F, Flow cytometric analysis of intestinal L-cells. The x-axis represents fluorescence intensity at 525 nm, whereas the y-axis represents nonspecific fluorescence at 575 nm. Note that cells with specific fluorescence were detected only in Gcggfp/+ and Gcggfp/gfp mice, and the populations did not differ between in Gcggfp/+ and Gcggfp/gfp. Representative results from at least three independent experiments using animals of different sex or different age are shown.
Fig. 8.
Fig. 8.
Expression of genes encoding transcription factors in pancreas and intestine. A, Gene expression in pancreas. B, Expression levels of Arx in intestine. White bars, Gcg+/+; gray bars, Gcggfp/+; black bars, Gcggfp/gfp. *, P < 0.05; **, P < 0.01;***, P < 0.001.

Similar articles

Cited by

References

    1. Kieffer TJ, Habener JF1999. The glucagon-like peptides. Endocr Rev 20:876–913 - PubMed
    1. Dey A, Lipkind GM, Rouillé Y, Norrbom C, Stein J, Zhang C, Carroll R, Steiner DF2005. Significance of prohormone convertase 2, PC2, mediated initial cleavage at the proglucagon interdomain site, Lys70-Arg71, to generate glucagon. Endocrinology 146:713–727 - PubMed
    1. Drucker DJ2006. The biology of incretin hormones. Cell Metab 3:153–165 - PubMed
    1. Lovshin JA, Drucker DJ2009. Incretin-based therapies for type 2 diabetes mellitus. Nat Rev Endocrinol 5:262–269 - PubMed
    1. Gelling RW, Du XQ, Dichmann DS, Romer J, Huang H, Cui L, Obici S, Tang B, Holst JJ, Fledelius C, Johansen PB, Rossetti L, Jelicks LA, Serup P, Nishimura E, Charron MJ2003. Lower blood glucose, hyperglucagonemia, and pancreatic α-cell hyperplasia in glucagon receptor knockout mice. Proc Natl Acad Sci USA 100:1438–1443 - PMC - PubMed

Publication types