. 2009 Dec;191(24):7436-46.
doi: 10.1128/JB.00412-09. Epub 2009 Oct 9.

Growth phase and (p)ppGpp control of IraD, a regulator of RpoS stability, in Escherichia coli

Affiliations

Growth phase and (p)ppGpp control of IraD, a regulator of RpoS stability, in Escherichia coli

Houra Merrikh et al. J Bacteriol. 2009 Dec.

Abstract

The antiadaptor protein IraD inhibits the proteolysis of the alternative sigma factor, RpoS, which promotes the synthesis of >100 genes during the general stress response and during stationary phase. Our previous results showed that IraD determines RpoS steady-state levels during exponential growth and mediates its stabilization after DNA damage. In this study, we show by promoter fusions that iraD was upregulated during the transition from exponential growth to stationary phase. The levels of RpoS likewise rose during this transition in a partially IraD-dependent manner. The expression of iraD was under the control of ppGpp. The expression of iraD required RelA and SpoT (p)ppGpp synthetase activities and was dramatically induced by a "stringent" allele of RNA polymerase, culminating in elevated levels of RpoS. Surprisingly, DksA, normally required for transcriptional effects of the stringent response, repressed iraD expression, suggesting that DksA can exert regulatory effects independent of and opposing those of (p)ppGpp. Northern blot analysis and 5' rapid amplification of cDNA ends revealed two transcripts for iraD in wild-type strains; the smaller was regulated positively by RelA during growth; the larger transcript was induced specifically upon transition to stationary phase and was RelA SpoT dependent. A reporter fusion to the distal promoter indicated that it accounts for growth-phase regulation and DNA damage inducibility. DNA damage inducibility occurred in strains unable to synthesize (p)ppGpp, indicating an additional mode of regulation. Our results suggest that the induction of RpoS during transition to stationary phase and by (p)ppGpp occurs at least partially through IraD.


Figures

FIG. 1.
FIG. 1.
Mapping of the iraD TSSs and correlation of iraD expression with growth phase and RpoS levels. (A) Agarose gel of 5′ RACE PCR products generated from MG1655 cells in either logarithmic or stationary phase as indicated. Sequencing of the PCR products revealed two products of 794 and 514 bp, predicting transcript lengths of ∼800 and 500 nt, respectively. Neither transcript is present in ΔiraD cells (data not shown). (B) Map of the two TSSs identified in the iraD 5′ upstream region based on the sequencing data after the 5′ RACE shown in panel A. TSSs are indicated with their positions relative to the 5′ end of the iraD ORF, and putative −10 and −35 elements are indicated for each. The distal promoter is labeled as P1, and the proximal promoter is labeled as P2. (C) iraD::luxCDABE expression for the full-length promoter, the distal promoter P1, and the proximal promoter P2 throughout growth. Full-length reporter is a fusion of positions −600 to −1, the P1 reporter is a fusion of positions −600 to −375, and the P2 reporter is a fusion of positions −262 to −1 to luciferase (numbers are relative to the start of ORF-ATG). Each data point is an average of six independent determinations. The variability is shown with error bars in both graphs. RLU, relative luminescence units (bioluminescence counts per minute, normalized to the OD600). The right panel shows the growth curve of wild-type cells in the experimental conditions used in the present study. The ODs are shown for time points of 20 min, starting at 90 min after the inoculation of each culture. (D) Steady-state RpoS levels in MG1655 and ΔiraD strains throughout growth. Samples were taken at ODs indicated, and TCA-precipitated as described in the methods section.
FIG. 2.
FIG. 2.
iraD::luxCDABE expression in strains affected for (p)ppGpp synthesis. Each data point is an average of four independent determinations. The variability is shown with error bars in both graphs. RLU, relative luminescence units (bioluminescence counts per minute, normalized to the OD600). Wild-type, spoT(E319Q), and relA on the graph represent expression in the MG1655, spoT(E319Q), and relAΔ::FRT strains, respectively, and relA spoT represents expression in the ΔrelA ΔspoT double mutant. (A and B) Luciferase expression of the full-length iraD::luxCDABE fusion construct throughout growth. (C) Expression of a luciferase construct, fused to the −600 to −375 region of the iraD promoter containing the P1 start site at −417, throughout growth. (D) Expression of a luciferase construct, fused to the −262 to −1 region of the iraD upstream region containing the P2 start site at −137, throughout growth.
FIG. 3.
FIG. 3.
Northern blot analysis of iraD transcripts in the MG1655, spoT(E319Q), relAΔ::FRT, and relAΔ spoTΔ strains. Samples were prepared from cells grown to either an OD of 0.7 (±0.1) or 1.6 (±0.1) as indicated. The graphs below the Northern blots show quantification of each transcript in that condition relative to 16S rRNA, in the strain indicated. Gray bars represent the smaller transcript of ∼500 nt, and the black bars represent the larger transcript of 800 nt.
FIG. 4.
FIG. 4.
Expression of the full-length IraD promoter fusion (iraD::luxCDABE) in strains lacking DksA. Each data point is an average of four independent determinations. The variability is shown with error bars in both graphs. RLU, relative luminescence units (bioluminescence counts per minute, normalized to the OD600). (A) Wild-type and dksA strains on graph represent data from iraD::luxCDABE expression in the MG1655 and ΔdksA::FRT cat strains, respectively. (B) Northern blot analysis of iraD transcripts in the MG1655 and ΔdksA::FRT cat strains. Samples were prepared from cell grown to either an OD of 0.7 (±0.1) or 1.6 (±0.1) as indicated. The graphs below the Northern blots show quantification of each transcript in that condition relative to 16S rRNA loading control, in the strain indicated. Gray bars represent the smaller transcript of 500 nt, and the black bars represent the larger transcript of 800 nt.
FIG. 5.
FIG. 5.
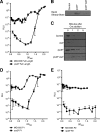
Effects of a stringent rpoB allele on iraD transcription and RpoS levels. (A) iraD::luxCDABE expression from a −600 to −1 fusion construct in a “stringent” RNA polymerase mutant. Each data point is an average of three independent determinations. Wild-type and rpoB* represent iraD::luxCDABE expression in the MG1655 and the rpoB* strains, respectively. The variability is shown with error bars in both graphs. RLU, relative luminescence units (bioluminescence counts per minute, normalized to the OD600). (B) Steady-state RpoS levels in MG1655 (Ctrl), rpoB*, and rpoB* iraD double-mutant strains at a growth phase corresponding to an OD600 of 0.3. (C) RpoS stability in the same strains at the same growth stage, following chloramphenicol treatment to block new protein synthesis. Levels of RpoS are shown at times indicated after chloramphenicol treatment. (D and E) Luciferase expression from promoter fusions to P1 (−600 to −375) (D) or P2 (−262 to −1) of the iraD upstream region (E). The data represent averages of at least three determinations.
FIG. 6.
FIG. 6.
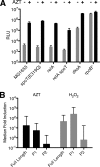
Expression of various iraD::luxCDABE reporters in response to DNA damage. (A) Gray bars show expression in response to H2O (Ctrl), and black bars show expression in response to 1 μg of AZT/ml for at least two isolates. RLU, relative luminescence units (bioluminescence counts per minute, normalized to the OD600). (B) iraD::luxCDABE expression for the 600-bp promoter fusion (P1 and P2), the distal promoter P1, and the proximal promoter P2 after treatment with either AZT or peroxide as indicated, normalized to untreated controls. Each data point represents the median value derived from data from at least eight isolates.

References

    1. Aberg, A., J. Fernández-Vázquez, J. D. Cabrer-Panes, A. Sánchez, and C. Balsalobre. 2009. Similar and divergent effects of ppGpp and DksA deficiencies on transcription in Escherichia coli. J. Bacteriol. 191:3226-3236. - PMC - PubMed
    1. Aberg, A., V. Shingler, and C. Balsalobre. 2008. Regulation of the fimB promoter: a case of differential regulation by ppGpp and DksA in vivo. Mol. Microbiol. 67:1223-1241. - PubMed
    1. Barker, M. M., T. Gaal, C. A. Josaitis, and R. L. Gourse. 2001. Mechanism of regulation of transcription initiation by ppGpp. I. Effects of ppGpp on transcription initiation in vivo and in vitro. J. Mol. Biol. 305:673-688. - PubMed
    1. Barker, M. M., and R. L. Gourse. 2001. Regulation of rRNA transcription correlates with nucleoside triphosphate sensing. J. Bacteriol. 183:6315-6323. - PMC - PubMed
    1. Bearson, S. M., W. H. Benjamin, Jr., W. E. Swords, and J. W. Foster. 1996. Acid shock induction of RpoS is mediated by the mouse virulence gene mviA of Salmonella typhimurium. J. Bacteriol. 178:2572-2579. - PMC - PubMed

Publication types

MeSH terms

LinkOut - more resources