. 2009 Oct 27;106(43):18207-12.
doi: 10.1073/pnas.0910177106. Epub 2009 Oct 9.

Immediate mediators of the inflammatory response are poised for gene activation through RNA polymerase II stalling

Affiliations

Immediate mediators of the inflammatory response are poised for gene activation through RNA polymerase II stalling

Karen Adelman et al. Proc Natl Acad Sci U S A. .

Abstract

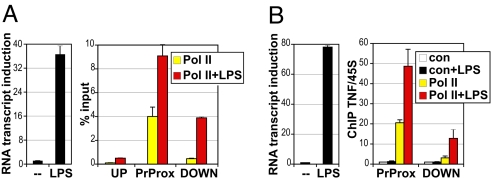
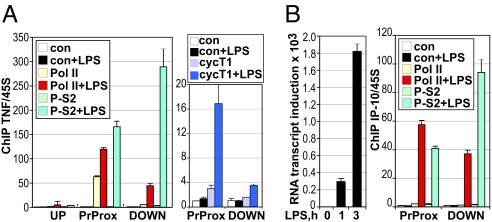
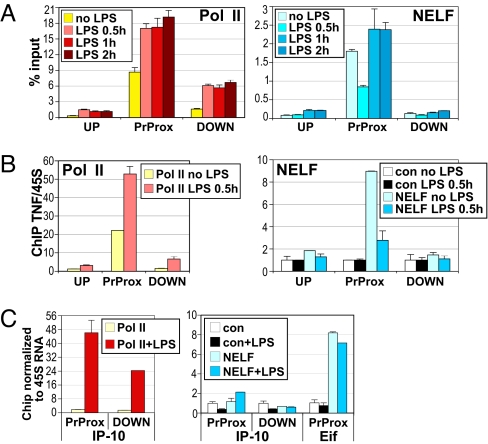
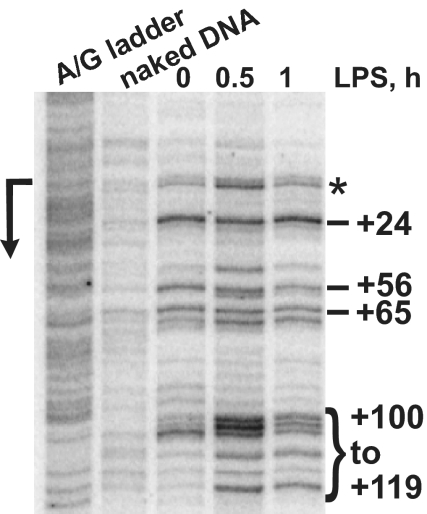
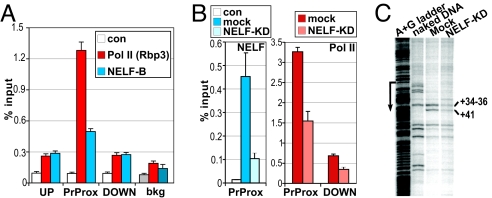
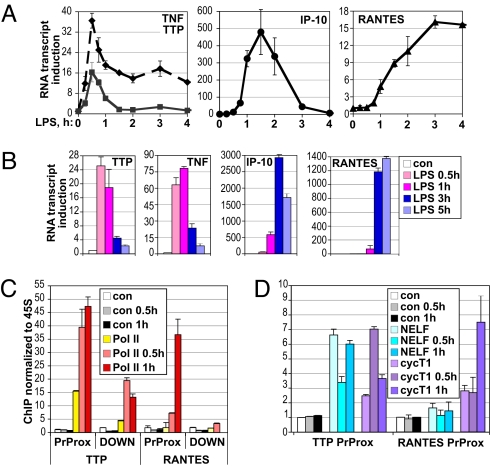
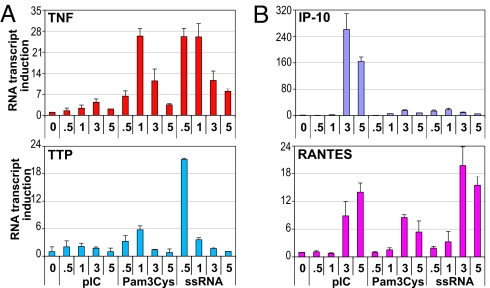
The kinetics and magnitude of cytokine gene expression are tightly regulated to elicit a balanced response to pathogens and result from integrated changes in transcription and mRNA stability. Yet, how a single microbial stimulus induces peak transcription of some genes (TNFalpha) within minutes whereas others (IP-10) require hours remains unclear. Here, we dissect activation of several lipopolysaccharide (LPS)-inducible genes in macrophages, an essential cell type mediating inflammatory response in mammals. We show that a key difference between the genes is the step of the transcription cycle at which they are regulated. Specifically, at TNFalpha, RNA Polymerase II initiates transcription in resting macrophages, but stalls near the promoter until LPS triggers rapid and transient release of the negative elongation factor (NELF) complex and productive elongation. In contrast, no NELF or polymerase is detectible near the IP-10 promoter before induction, and LPS-dependent polymerase recruitment is rate limiting for transcription. We further demonstrate that this strategy is shared by other immune mediators and is independent of the inducer and signaling pathway responsible for gene activation. Finally, as a striking example of evolutionary conservation, the Drosophila homolog of the TNFalpha gene, eiger, displayed all of the hallmarks of NELF-dependent polymerase stalling. We propose that polymerase stalling ensures the coordinated, timely activation the inflammatory gene expression program from Drosophila to mammals.


Conflict of interest statement

The authors declare no conflict of interest.

Figures

Fig. 1.
Fig. 1.
Pol II occupies the promoter of the TNFα gene before activation. RAW264.7 cells (A) and day 7 BMMΦ (B) were treated with LPS (1 μg/mL for 0.5 h and 10 ng/mL for 1 h, respectively) and the induction of TNFα transcript was measured by real-time qPCR (Left) or cells were subjected to ChIP (Right). For RAW264.7 cells (A) ChIP material precipitated with antibodies to Pol II was quantified by real-time qPCR using primers centered around the upstream (UP), promoter-proximal (PrProx), and downstream (DOWN) regions of the TNFα gene and expressed as percentage of input DNA obtained in each sample. n = 3, error is SEM. For BMMΦ (B) ChIP material precipitated with normal rabbit IgG (con) or equivalent amount of antibodies to Pol II was qPCR quantified with primers to PrProx and DOWN regions of the TNFα gene and normalized to corresponding signals at the unrelated 45S rRNA gene as an internal control; the value of IgG control in untreated cells was set to 1 for both locations. n = 3, error is SEM.
Fig. 2.
Fig. 2.
TNFα but not IP-10 display the hallmarks of Pol II stalling. BMMΦ derived and treated as in Fig. 1B were subjected to ChIP with IgG control, antibodies to Pol II, P-S2, or cyclin T1, as indicated. Occupancy at the UP, PrProx, and DOWN regions of the TNFα gene (A) or PrProx and DOWN regions of the IP-10 gene (B Right) was assessed as in Fig. 1B. IP-10 RNA induction (B Left) in BMMΦ treated with LPS for 0, 1, or 3 h was assessed as in Fig. 1B.
Fig. 3.
Fig. 3.
NELF complex is present in mouse splenic MΦ. F4/80, NELF-E, and CD3 immunohistochemistry in a C57BL/6 mouse spleen is shown. Serial 5-μm sections are shown with 2× (Left) and 40× (Right) magnification. (Scale bar, 100 μm.) F4/80 positive cells consistent with MΦ represent the predominant cell population throughout the splenic red pulp (A and D). Note the strong and specific immunostaining for NELF-E within cell nuclei in these MΦ-rich areas (B and E). CD3-positive T cells are largely confined to the periarteriolar lymphoid sheath region of the white pulp, but small numbers of T cells are also scattered throughout the red pulp (C and F).
Fig. 4.
Fig. 4.
The NELF complex dissociates from the TNFα promoter during the peak of gene activation. LPS-dependent dismissal of NELF from the TNFα promoter in RAW264.7 cells (A) and primary BMMΦ (B) is shown. Cells were derived and treated and ChIP assays performed as in Fig. 1. Pol II and NELF occupancy at the UP, PrProx, and DOWN regions of the TNFα gene is shown. (C) The IP-10 promoter is not occupied by the NELF complex in primary BMMΦ. Cells were treated with LPS for 1 h, as indicated, and Pol II and NELF-A occupancy at the PrProx and DOWN regions of IP-10 and the PrProx region of the Eif4a1 gene was assessed as in Fig. 1B.
Fig. 5.
Fig. 5.
In vivo permanganate probing of the TNFα gene in BMMΦ reveals a promoter-proximal open transcription bubble consistent with Pol II stalling. Day 7 BMMΦ were treated with LPS for the indicated times, harvested in ice-cold PBS, and subjected to permanganate footprinting (see Methods). Dashes indicate the unpaired thymine bases within the area from the TSS (arrow on the left) to ≈+100 in untreated cells (“0”). A bracket marks additional KMnO4 reactivity appearing from +100 to +119 in response to LPS. Note several reactive bands including that near the promoter (asterisk) that are specifically enhanced at 0.5 h of LPS treatment and decay thereafter. A + G sequencing ladder and KMnO4 probing of purified “naked” DNA are shown.
Fig. 6.
Fig. 6.
Eiger, the Drosophila homolog of TNFα, is a target of NELF-dependent Pol II stalling. (A) Pol II and NELF occupy the promoter-proximal region of the uninduced eiger gene. ChIP was performed on Drosophila S2 cells with antibodies to the Rpb3 subunit of Pol II or NELF-B or with no antibody (con). Occupancy at the UP, PrProx, and DOWN regions of eiger (or an intergenic region to assess the background of the assay, bkg) was assessed by qPCR and expressed as percentage of input; n = 4, error is SEM. (B) Depletion of NELF reduces Pol II occupancy at the eiger promoter. S2 cells were mock treated or NELF-B depleted using RNAi (NELF KD). ChIP with no antibody (con) or antibodies to NELF-B (Left) or Pol II (Right) was performed as in A. (C) The permanganate footprint in the eiger promoter-proximal region is dependent on NELF. Lanes depict, left to right: the A + G ladder used to determine the position of the promoter (arrow), the KMnO4 reactivity of naked DNA as a control, and KMnO4 reactivity of eiger in S2 cells (mock-treated or NELF KD).
Fig. 7.
Fig. 7.
Pol II stalling correlates with rapid and transient RNA induction of LPS-inducible genes in MΦ. RAW264.7 cells (A) or BMMΦ (B) were treated for the indicated times with LPS, total RNA was isolated, and the expression of the indicated genes was assessed by real-time qPCR, normalized to β-actin and defined as fold induction over that in untreated cells (set as 1). Shown is a representative of 2–3 independent experiments performed in duplicate. (C and D) TTP but not RANTES promoter is occupied by stalled Pol II in MΦ. BMMΦ were treated with LPS for the indicated times and processed for ChIP as in Fig. 1B. Occupancy of Pol II at the PrProx and DOWN (C) and of NELF-A and cycT1 at the PrProx (D) regions of TTP and RANTES was assessed. Shown is 1 of 2 independent experiments done in duplicate.
Fig. 8.
Fig. 8.
The induction profile of TLR-responsive genes in BMMΦ reflects the rate-limiting step in transcription rather than the nature of an inducer. Day 7 BMMΦ were treated for the indicated times with 5 μg/mL poly(IC), 100 ng/mL Pam3Cys, and 10 ng/mL ssRNA, and total RNA was isolated and reverse transcribed. The expression of (A) TNFα and TTP and (B) IP-10 and RANTES was assessed as in Fig. 7B.

References

    1. Kawai T, Akira S. Pathogen recognition with Toll-like receptors. Curr Opin Immunol. 2005;17:338–344. - PubMed
    1. Barton GM, Medzhitov R. Toll-like receptor signaling pathways. Science. 2003;300:1524–1525. - PubMed
    1. Foster SL, Medzhitov R. Gene-specific control of the TLR-induced inflammatory response. Clin Immunol. 2009;130:7–15. - PMC - PubMed
    1. Bennett L, et al. Interferon and granulopoiesis signatures in systemic lupus erythematosus blood. J Exp Med. 2003;197:711–723. - PMC - PubMed
    1. Chu CQ, Field M, Feldmann M, Maini RN. Localization of tumor necrosis factor alpha in synovial tissues and at the cartilage-pannus junction in patients with rheumatoid arthritis. Arthritis Rheum. 1991;34:1125–1132. - PubMed

Publication types

MeSH terms

LinkOut - more resources