. 2009 Oct;21(10):3350-67.
doi: 10.1105/tpc.109.070607. Epub 2009 Oct 9.

Overexpression of several Arabidopsis histone genes increases agrobacterium-mediated transformation and transgene expression in plants

Affiliations

Overexpression of several Arabidopsis histone genes increases agrobacterium-mediated transformation and transgene expression in plants

Gabriela N Tenea et al. Plant Cell. 2009 Oct.

Abstract

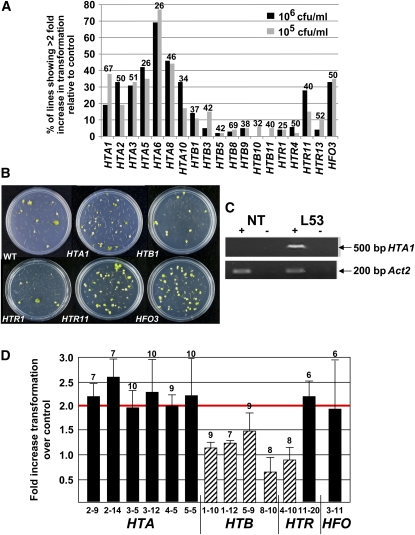
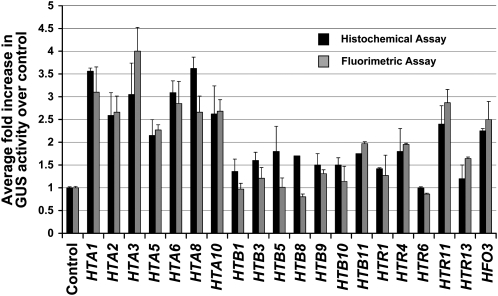
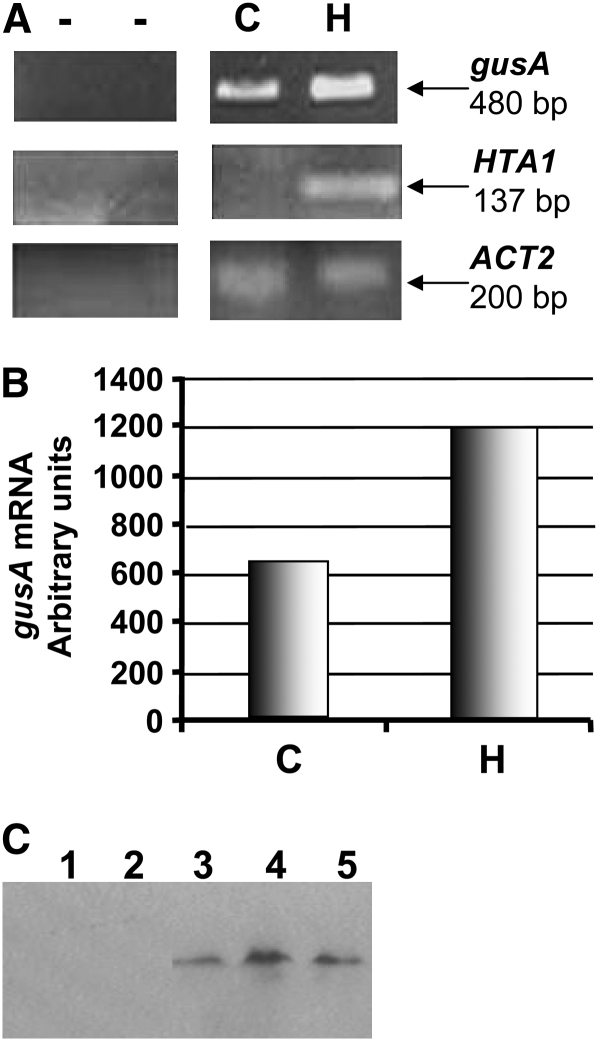
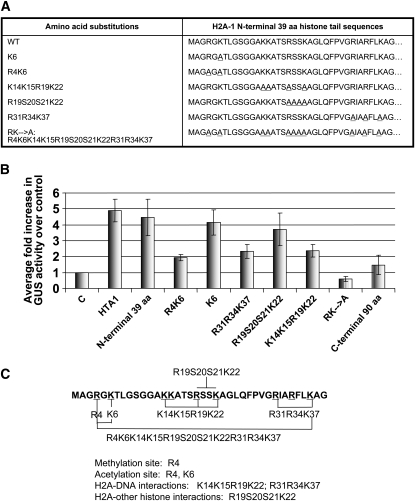
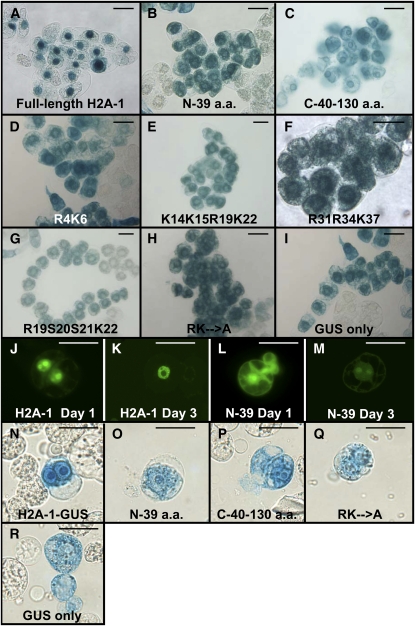
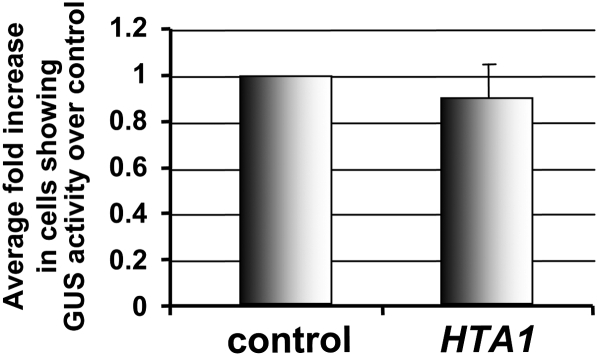
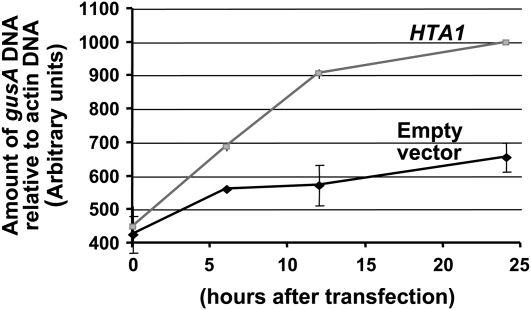
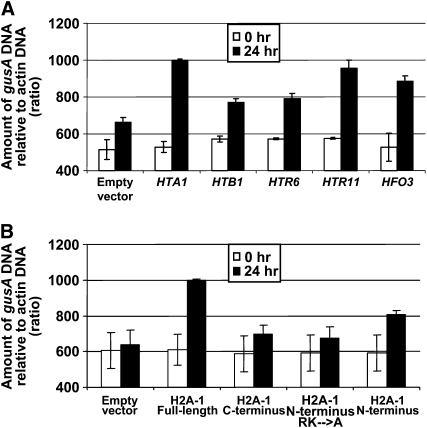
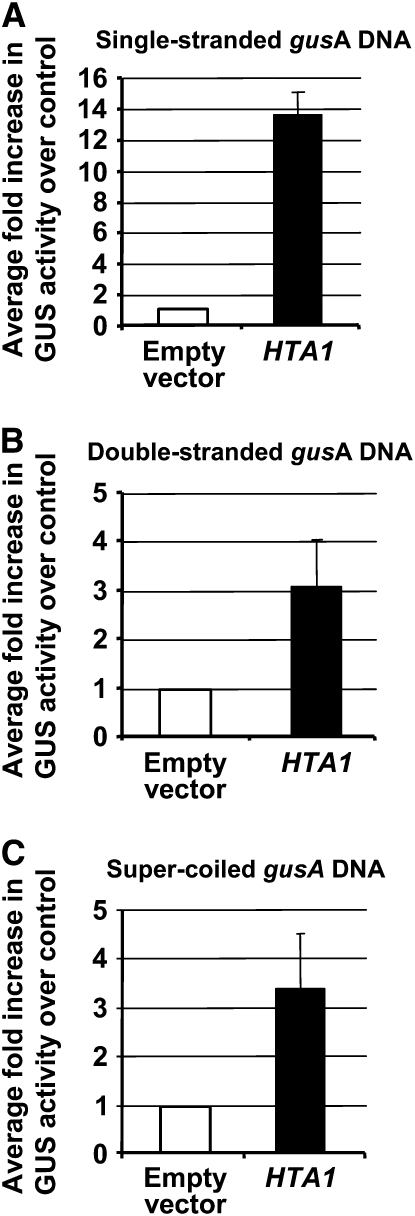
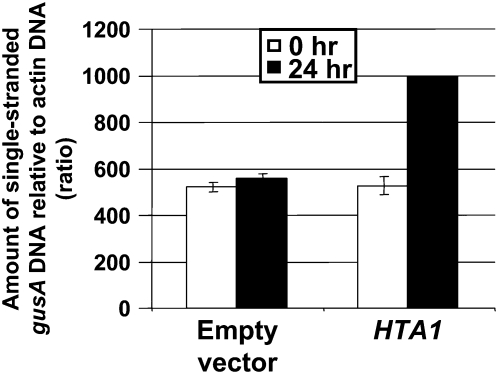
The Arabidopsis thaliana histone H2A-1 is important for Agrobacterium tumefaciens-mediated plant transformation. Mutation of HTA1, the gene encoding histone H2A-1, results in decreased T-DNA integration into the genome of Arabidopsis roots, whereas overexpression of HTA1 increases transformation frequency. To understand the mechanism by which HTA1 enhances transformation, we investigated the effects of overexpression of numerous Arabidopsis histones on transformation and transgene expression. Transgenic Arabidopsis containing cDNAs encoding histone H2A (HTA), histone H4 (HFO), and histone H3-11 (HTR11) displayed increased transformation susceptibility, whereas histone H2B (HTB) and most histone H3 (HTR) cDNAs did not increase transformation. A parallel increase in transient gene expression was observed when histone HTA, HFO, or HTR11 overexpression constructs were cotransfected with double- or single-stranded forms of a gusA gene into tobacco (Nicotiana tabacum) protoplasts. However, these cDNAs did not increase expression of a previously integrated transgene. We identified the N-terminal 39 amino acids of H2A-1 as sufficient to increase transient transgene expression in plants. After transfection, transgene DNA accumulates more rapidly in the presence of HTA1 than with a control construction. Our results suggest that certain histones enhance transgene expression, protect incoming transgene DNA during the initial stages of transformation, and subsequently increase the efficiency of Agrobacterium-mediated transformation.


Figures

Figure 1.
Figure 1.
Overexpression of Specific Arabidopsis Core Histone cDNAs Increases Agrobacterium-Mediated Transformation. (A) Roots segments from T1 generation plants containing the indicated histone cDNAs, as well as root segments from Wassilewskija (Ws) wild-type plants, were inoculated with either 105 or 106 cfu/mL of the tumorigenic strain Agrobacterium A208. After 2 d, roots segments were transferred to Murashige and Skoog (MS) medium containing 100 μg/mL Timentin to kill bacteria. The percentage of root segments developing tumors was scored after 1 month. A histone gene was considered to increase transformation efficiency if at least 25% of the lines containing that particular cDNA showed a minimum twofold increase in transformation efficiency relative to that of wild-type plants. Numbers above each bar represent the number of independent T1 generation transgenic plants assayed for each histone construction, as depicted in Supplemental Figure 2 online. Additional sets of transformation data were also collected, with similar results. (B) After 1 month, representative plates of tumors growing on inoculated transgenic Arabidopsis root segments were photographed. (C) RNA was extracted from a nontransformed line (NT) and transgenic line L53 (which has increased susceptibility to Agrobacterium-mediated transformation and contains a HTA1 cDNA expression cassette) and assayed for HTA1 and Act2 mRNA by RT-PCR. The HTA1 primers were designed to amplify only HTA1 transgene mRNA and not endogenous HTA1 mRNA. +, reverse transcriptase present in the reaction mix; −, reverse transcriptase absent in the reaction mix. (D) Roots of T2 generation plants from selected lines showing ≥2-fold increased transformation in T1 generation plants (HTA lines 2-9, 2-14, 3-5, 3-12, 4-5, and 5-5, HTR line 11-20, and HFO line 3-11; solid bars), lines not showing increased transformation in T1 generation plants (HTB lines 1-10, 1-12, 5-9, and 8-10, and HTR line 4-10; diagonal striped bars), and wild-type plants were assayed for transformation susceptibility as described above. Numbers above each bar indicate the number of individual plants assayed from each line. Line numbers are designated as follows: the first number identifies the histone gene, and the second number indicates the particular transgenic line. Error bars indicate se.
Figure 2.
Figure 2.
Overexpression of Specific Histone cDNAs Increases gusA Transgene Expression in Transiently Transfected Tobacco BY-2 Protoplasts. Tobacco BY-2 protoplasts were cotransfected with a gusA reporter gene and either a histone cDNA expression cassette or an empty vector control plasmid. Histochemical and fluorimetric assays were performed 24 h after transfection. For histochemical analysis, >1000 cells were examined for each treatment to determine the percentage of cells staining blue with X-gluc. The number reported is the average percent of blue cells for each line divided by the percent of blue cells for the empty vector control. Fluorimetric assays measured GUS-specific activity as average fluorescence intensity of each line divided by the fluorescence intensity of the empty vector control. Numbers represent GUS activity relative to that of the control. Error bars indicate se of at least three biological replicates.
Figure 3.
Figure 3.
gusA mRNA Steady State Levels Increase When Tobacco BY-2 Protoplasts Are Cotransfected with a HTA1 cDNA. (A) Tobacco BY-2 protoplasts were cotransfected with a gusA expression cassette and either a HTA1 cDNA expression cassette or an empty vector control plasmid. After 24 h, RNA was extracted and subjected to RT-PCR. gusA mRNA levels were determined in cells cotransfected with an empty vector control plasmid (C) or a HTA1 cDNA expression cassette (H). gusA mRNA levels were normalized relative to actin mRNA levels. (B) Graphical representation of the increase in gusA mRNA after coelectroporation of the gusA expression cassette and either an empty vector or a HTA1 cDNA expression cassette. (C) Proteins were extracted from tobacco BY-2 protoplasts 24 h after electroporation of an untagged HTA1 gene (lanes 1 and 2, representing two independent experiments) or a gene encoding a HTA1-T7 tag fusion protein (lanes 3 to 5, representing three independent experiments). Total cellular proteins were subjected to protein gel blot analysis using antibodies directed against the T7 tag. Inclusion of an HTA1-YFP gene in each electroporation experiment, followed by fluorescent imaging of the cells, indicated that electroporation was successful for each experiment.
Figure 4.
Figure 4.
The N-Terminal 39 Amino Acids of Histone H2A-1 Are Sufficient to Increase gusA Transgene Expression in Tobacco BY-2 Protoplasts. (A) Amino acid sequence substitutions in the N-terminal H2A-1 region. Underlined amino acids in the right panel were substituted by Ala. (B) Relative GUS activity in protoplasts cotransfected with a gusA expression cassette and various H2A-1 wild-type and mutant peptides. Numbers represent GUS activity relative to the empty vector control. Transfected cells were stained histochemically with X-gluc and examined microscopically 24 h later. More than 1000 cells were examined for each treatment. Error bars indicate se of at least three biological replicates. (C) The first 39 amino acids of the histone H2A-1 protein. Specific amino acid mutations within this region are marked. Amino acids involved in acetylation, histone–DNA interactions, and histone–histone interactions are indicated.
Figure 5.
Figure 5.
Subcellular Localization of Full-Length Histone H2A-1 and Various Mutant Peptides Fused to Either GUS or YFP Reporter Proteins. (A) to (I) X-gluc staining of stably transformed tobacco BY-2 cell lines expressing the indicated GUS fusion proteins. Note that expression of an unfused gusA gene results in cytoplasmic staining of the cells (I), whereas expression of a full-length H2A-1-GUS fusion protein results in predominantly nuclear staining (A). Expression of the various H2A-1 mutant peptides results in predominantly cytoplasmic, especially perinuclear, staining ([B] to [H]). (J) to (M) Epifluorescence images of tobacco BY-2 protoplasts 1 d ([J] and [L]) or 3 d ([K] or [M]) after transfection with the indicated constructions. Note that the full-length H2A-1-YFP fusion protein localizes predominantly to the nucleus ([J] and [K]) but that the N-terminal H2A-1-YFP fusion protein localizes throughout the cell ([L] and [M]). YFP fluorescence is shown in yellow-green. (N) to (R) X-gluc staining of transfected tobacco BY-2 protoplasts expressing the indicated GUS fusion proteins 1 d after transfection. Bars = 50 μM.
Figure 6.
Figure 6.
Overexpression of HTA1 in Stably Transformed Tobacco BY-2 Cells Does Not Increase Activity of a Previously Integrated gusA Gene. Protoplasts isolated from a BY-2 line stably expressing a gusA gene were transfected with either a control empty vector or HTA1 expression constructions. After 24 h, the cells were stained with X-gluc, and the percentage of cells showing GUS activity was determined. Numbers represent GUS activity relative to the control. More than 1000 cells were examined for each treatment. Error bars indicate se of three biological replicates.
Figure 7.
Figure 7.
Rate of Accumulation of gusA Double-Stranded DNA in Tobacco BY-2 Protoplasts Cotransfected with Either a HTA1 cDNA or an Empty Vector Control Plasmid. Protoplasts were electroporated with a gusA transgene, plus either an empty vector or a HTA1 expression construction. After various periods of time, samples were treated with DNase I, following which DNA was extracted. PCR was conducted to determine the amount of gusA DNA within the cell and normalized to the amount of actin DNA. Error bars indicate se of three biological replicates.
Figure 8.
Figure 8.
Accumulation of Double-Stranded gusA DNA in Tobacco BY-2 Protoplasts following Cotransfection with Constructions Expressing Various Histone cDNAs or Mutations of HTA1. Tobacco protoplasts were cotransfected with a gusA expression construction and either an empty vector control plasmid or constructions expressing various histone cDNAs or histone mutations. At 0 and 24 h after transfection, samples were treated with DNase I and DNA was extracted. PCR was conducted to determine the amount of gusA DNA within the cell, relative to actin DNA. The relative intensities of the ethidium-stained gel bands were determined by densitometric scanning, using Lab Works 4.1 software. Intensity is in arbitrary units, starting at 400. Error bars indicate se of two or three biological replicates. (A) Empty vector, empty vector + gusA gene; HTA1, HTA1 + gusA gene; HTB1, HTB1 + gusA gene; HTR6, HTR 6 + gusA gene; HTR11, HTR11 + gusA gene; HFO, HFO3 + gusA gene. (B) Empty vector, empty vector + gusA gene; H2A-1 full-length, full-length H2A-1 + gusA gene; H2A-1 C terminus, C-terminal region of H2A-1 + gusA gene; H2A-1 N terminus, N-terminal region of H2A-1 + gusA gene; H2A-1 N terminus RK→A, first 39 amino acids of H2A-1 in which all basic amino acids were converted to Ala + gusA gene.
Figure 9.
Figure 9.
Overexpression of a HTA1 cDNA Can Increase Expression of Various Forms of a Coelectroporated gusA DNA. Tobacco BY-2 protoplasts were cotransfected with various conformations of a gusA reporter gene and either a histone cDNA expression cassette or an empty vector control plasmid. After 24 h, the percentage of cells expressing GUS activity (X-gluc staining) was determined. The data are presented as the percentage of stained cells relative to that of the control. (A) Single-stranded gusA transgene. (B) Double-stranded gusA transgene. (C) Super-coiled gusA transgene. More than 1000 cells were examined for each treatment. Error bars indicate se.
Figure 10.
Figure 10.
Accumulation of Single-Stranded gusA DNA in Tobacco BY-2 Protoplasts following Cotransfection with HTA1. Tobacco BY-2 protoplasts were cotransfected with single-stranded gusA DNA and either a histone cDNA expression cassette or an empty vector control plasmid. At 0 and 24 h after transfection, samples were treated with DNase I and DNA was extracted. PCR was conducted to determine the amount of gusA DNA within the cell, relative to actin DNA. Error bars indicate se of two or three biological replicates.

Similar articles

Cited by

References

    1. Anand, A., Zarir, V., Ryu, C.M., Kang, L., del-Pozo, O., Martin, G.B., and Mysore, K.S. (2007). Identification of plant genes involved in Agrobacterium-mediated transformation by using virus induced gene silencing as a functional genomics tool. Mol. Plant Microbe Interact. 20 41–52. - PubMed
    1. Baake, M., Doenecke, D., and Albig, W. (2001). Characterisation of nuclear localisation signals of the four human core histones. J. Cell. Biochem. 81 333–346. - PubMed
    1. Balicki, D., Putnam, C.D., Scaria, P.V., and Beutler, E. (2002). Structure and function correlation in histone H2A peptide-mediated gene transfer. Proc. Natl. Acad. Sci. USA 99 7467–7471. - PMC - PubMed
    1. Ballas, N., and Citovsky, V. (1997). Nuclear localization signal binding protein from Arabidopsis mediates nuclear import of Agrobacterium VirD2 protein. Proc. Natl. Acad. Sci. USA 94 10723–10728. - PMC - PubMed
    1. Bhattacharjee S, Lee LY, Oltmanns H, Cao H, Veena, Cuperus J, Gelvin SB. (2008). AtImpa-4, an Arabidopsis importin α isoform, is preferentially involved in Agrobacterium-mediated plant transformation. Plant Cell 20 2661–2680. - PMC - PubMed

Publication types

MeSH terms

Substances

LinkOut - more resources