Meta-Analysis
. 2009 Nov;41(11):1182-90.
doi: 10.1038/ng.467. Epub 2009 Oct 11.

A genome-wide meta-analysis identifies 22 loci associated with eight hematological parameters in the HaemGen consortium

Affiliations
Meta-Analysis

A genome-wide meta-analysis identifies 22 loci associated with eight hematological parameters in the HaemGen consortium

Nicole Soranzo et al. Nat Genet. 2009 Nov.

Abstract

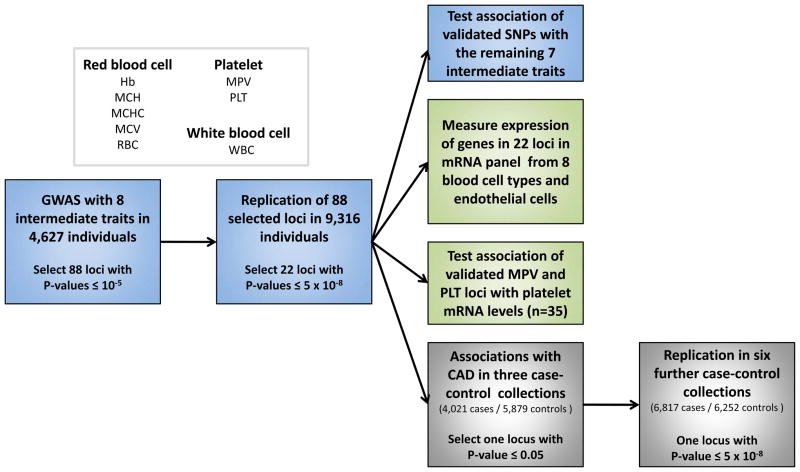
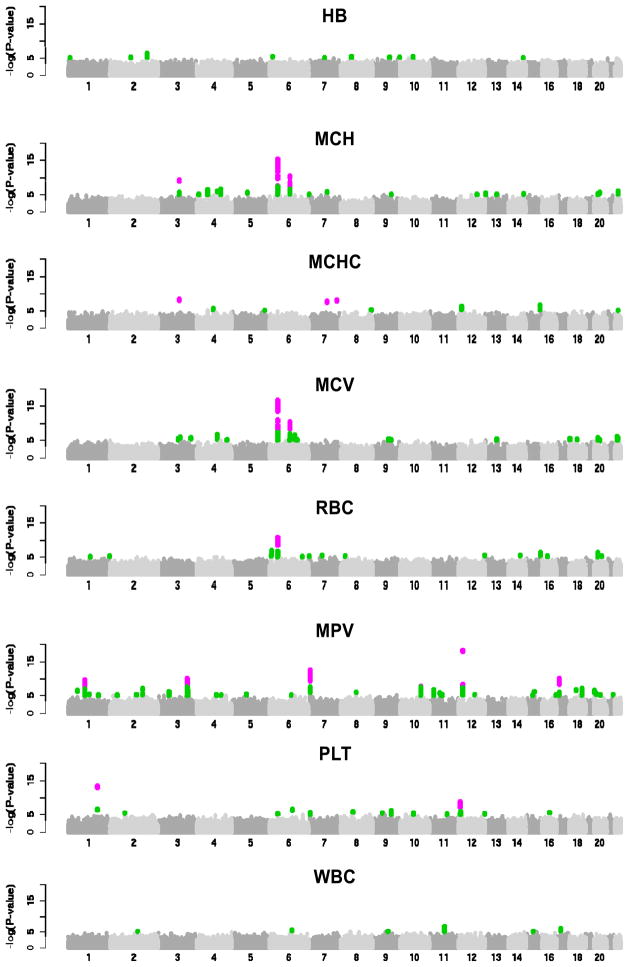
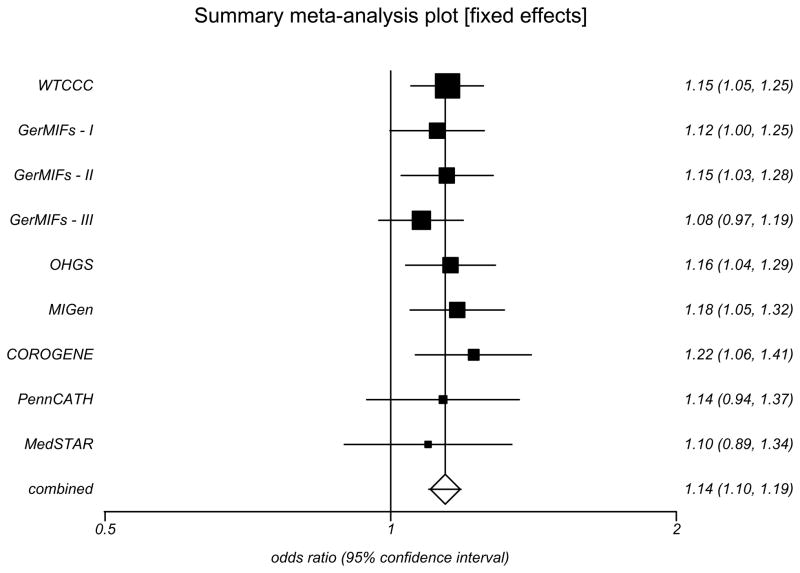
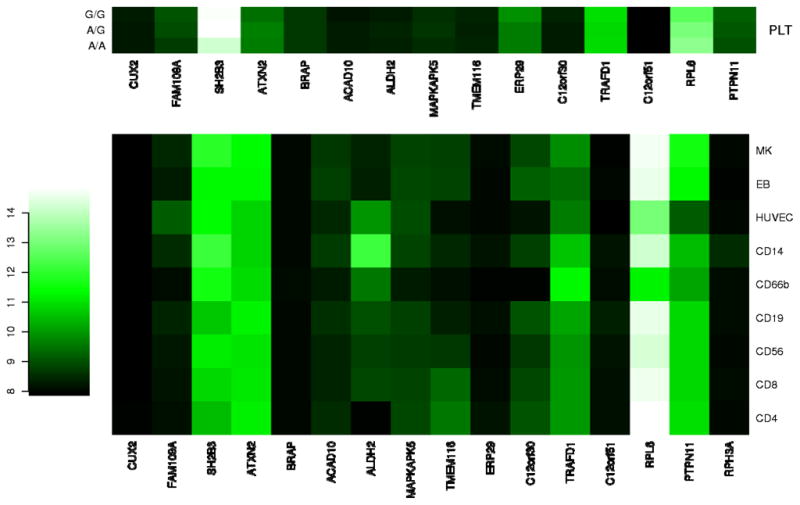
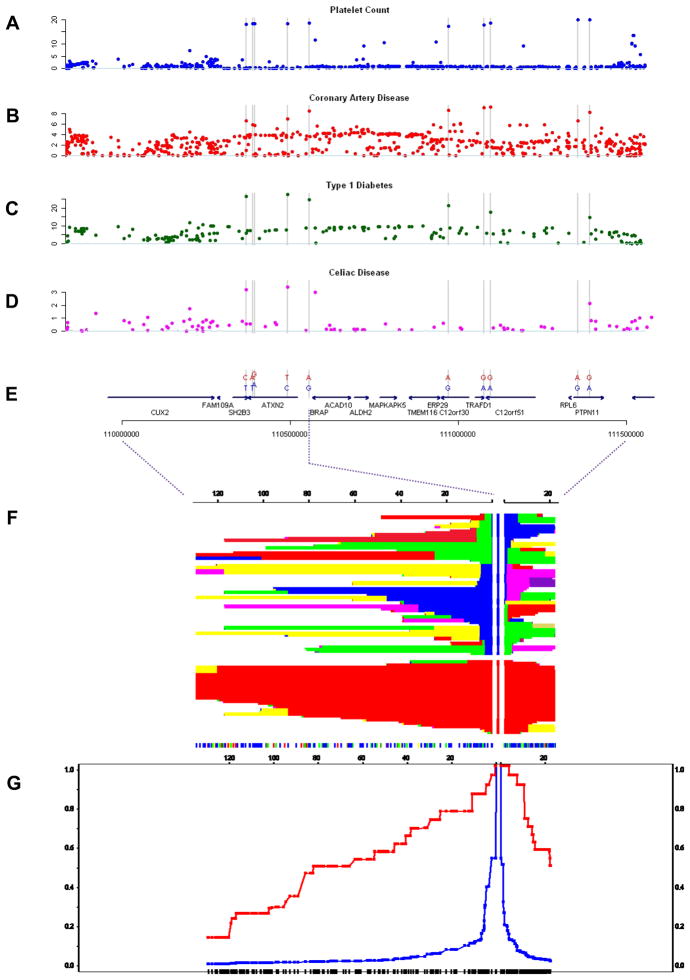
The number and volume of cells in the blood affect a wide range of disorders including cancer and cardiovascular, metabolic, infectious and immune conditions. We consider here the genetic variation in eight clinically relevant hematological parameters, including hemoglobin levels, red and white blood cell counts and platelet counts and volume. We describe common variants within 22 genetic loci reproducibly associated with these hematological parameters in 13,943 samples from six European population-based studies, including 6 associated with red blood cell parameters, 15 associated with platelet parameters and 1 associated with total white blood cell count. We further identified a long-range haplotype at 12q24 associated with coronary artery disease and myocardial infarction in 9,479 cases and 10,527 controls. We show that this haplotype demonstrates extensive disease pleiotropy, as it contains known risk loci for type 1 diabetes, hypertension and celiac disease and has been spread by a selective sweep specific to European and geographically nearby populations.


Figures

Figure 1
Figure 1
Summary of the study design.
Figure 2
Figure 2
Manhattan plots describing the association of 2.11 M SNPs with eight hematological traits in the three discovery samples (UKBS-CC1, TwinsUK and KORA F3 500K). SNPs with P≤ 10 are highlighted in green; SNPs exceeding the genome-wide significance threshold of 5 × 10 are shown in purple.
Figure 3
Figure 3
Multimarker score tests for MPV and MCV. (a) MPV scores were calculated from the 12 validated MPV loci and are given for individuals with ≤ 7, 8 17 and ≥ 18 MPV-increasing alleles. (b) MCV scores were calculated from six validated red blood cell loci. MCV multimarker scores were calculated for males and females separately to account for substantial differences among sexes. Gray bars indicate the number of individuals in each score class, dots and triangles indicate the mean MPV and mean MCV levels in each class with bars showing the associated standard errors (blue for males and magenta for females); the lines are the linear regressions though these points. The regression indicates an average increase of MPV of 0.12 fl per copy of MPV-increasing allele, corresponding to a variation of between 8.25 and 9.59 fl for individuals carrying between 7 and 18 copies of MPV-increasing alleles, respectively. The corresponding average increase in MCV was 0.47 fl per allele (range 90.60 93.86 fl for individuals carrying ≤1 or ≥8 copies of MCV-increasing alleles) in males and 0.47 fl (range 89.23–92.49 fl for the same range of alleles) in females, respectively.
Figure 4
Figure 4
Association of SNP rs11065987 with CAD. Pooled ORs and 95% CI were calculated in eight case-control studies of European origin under a fixed effects model, as there was no evidence for heterogeneity in associations at this locus. The remaining nine SNPs characterizing this haplotype are described in Supplementary Table 5.
Figure 5
Figure 5
Heatmap of mRNA expression in the 12q24 region. For all genes contained within the 1.6-Mb interval, VST-transformed signal intensities from using Illumina HumanWG-6 (v2) Expression BeadChip expression arrays were median-normalized and values were averaged across biological replicates in stem cell-derived erythroblasts (EBs, n = 4), megakaryocytes (MK, n = 4), human umbilical vein endothelial cells (HUVECs, n = 3), CD4+ Th (CD4, n = 7) and CD8+ Tc lymphocytes (CD8, n = 7), CD14+ monocytes (CD14, n = 7), CD19+ B lymphocytes (CD19, n = 7), CD56+ natural killer cells (CD56, n = 7) and CD66b+ granulocytes (CD66, n = 7). For platelet-associated signals, levels of gene expression in 35 platelet mRNA were averaged based on genotype at the leading or proxy SNP. Signal intensities obtained with platelets were obtained using Illumina HumanWG-6 (v1) Expression BeadChip expression arrays and were normalized independently from the remaining blood cell lines.
Figure 6
Figure 6
Overview of the 12q24 region. (a–d) The −log10 P value for associations with platelet counts (a), coronary artery disease (b), type 1 diabetes (c) and celiac disease (d), expressed in −log10(P value), are shown for two consecutive recombination intervals in a 1.6-MB region on chromosome 12 (Build 36 pos 109,896,664–111,516,664). (e) The position of the 10 SNPs forming a high frequency (MAF 40%) haplotype is highlighted by gray bars; this also displays the evolutionarily ancestral (blue) and derived (red) alleles at the 10 SNPs. (f,g) Signatures of positive selection obtained from Haplotter, including a graphical display of haplotypes at different distances from the lead SNP rs11065987 (f) and a plot marking the decay of extended haplotype homozygosity at different distances from SNP rs11065987 (g).

Comment in

References

    1. Garner C, et al. Genetic influences on F cells and other hematologic variables: a twin heritability study. Blood. 2000;95:342–346. - PubMed
    1. Evans DM, Frazer IH, Martin NG. Genetic and environmental causes of variation in basal levels of blood cells. Twin Res. 1999;2:250–257. - PubMed
    1. Ensrud K, Grimm RH. The white blood cell count and risk for coronary heart disease. Am Heart J. 1992;124:207–213. - PubMed
    1. Danesh J, Collins R, Appleby P, Peto R. Association of fibrinogen, C-reactive protein, albumin, or leukocyte count with coronary heart disease: meta-analyses of prospective studies. J Am Med Assoc. 1998;279:1477–1482. - PubMed
    1. Hoffman M, Blum A, Baruch R, Kaplan E, Benjamin M. Leukocytes and coronary heart disease. Atherosclerosis. 2004;172:1–6. - PubMed

Publication types

Substances