. 2009 Nov;15(11):1327-32.
doi: 10.1038/nm.2032. Epub 2009 Oct 11.

Matrix-insensitive protein assays push the limits of biosensors in medicine

Affiliations

Matrix-insensitive protein assays push the limits of biosensors in medicine

Richard S Gaster et al. Nat Med. 2009 Nov.

Abstract

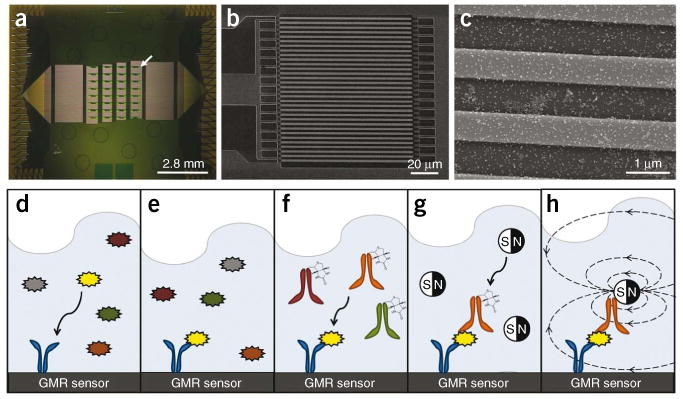
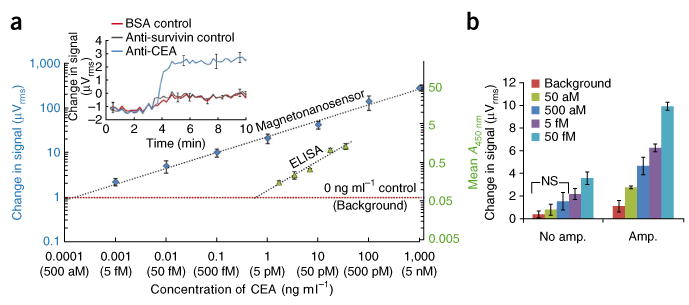
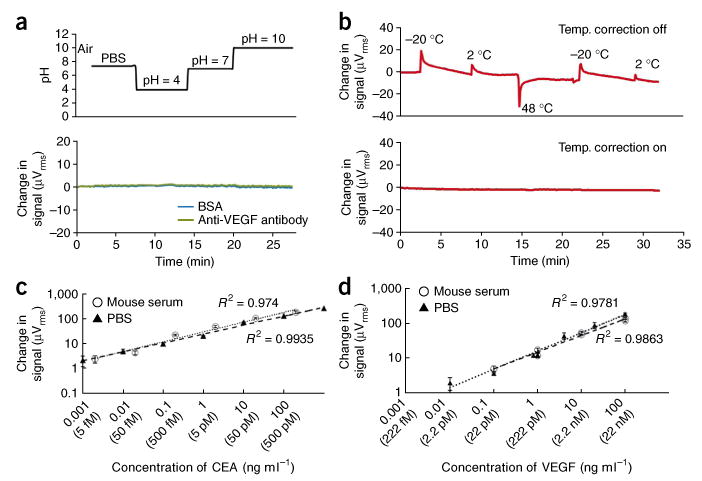
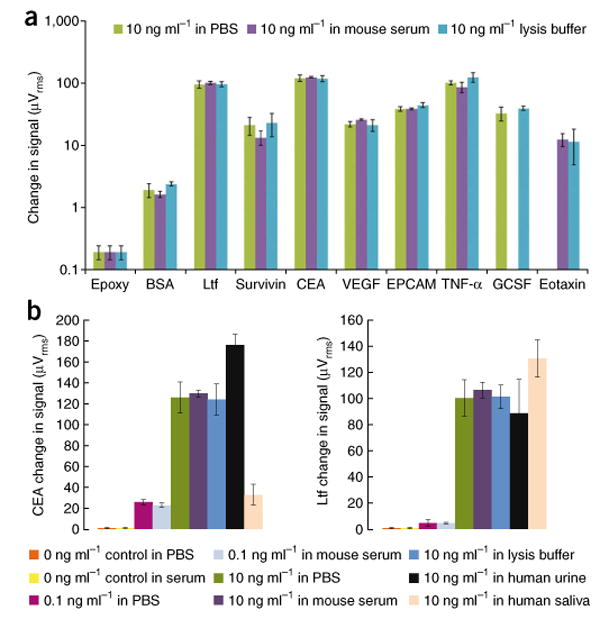
Advances in biosensor technologies for in vitro diagnostics have the potential to transform the practice of medicine. Despite considerable work in the biosensor field, there is still no general sensing platform that can be ubiquitously applied to detect the constellation of biomolecules in diverse clinical samples (for example, serum, urine, cell lysates or saliva) with high sensitivity and large linear dynamic range. A major limitation confounding other technologies is signal distortion that occurs in various matrices due to heterogeneity in ionic strength, pH, temperature and autofluorescence. Here we present a magnetic nanosensor technology that is matrix insensitive yet still capable of rapid, multiplex protein detection with resolution down to attomolar concentrations and extensive linear dynamic range. The matrix insensitivity of our platform to various media demonstrates that our magnetic nanosensor technology can be directly applied to a variety of settings such as molecular biology, clinical diagnostics and biodefense.


Figures

Figure 1
Figure 1
Sensor architecture and assay. (a) Image of our magnetonanosensor chip containing 64 sensors in an 8×8 array. Each green square is a uniquely addressable GMR sensor (white arrow). The horizontal lines leaving the sensors are leads connecting each sensor to a unique bond pad. (b) Scanning electron microscope (SEM) image of the sensor's serpentine architecture at 800×. (c) SEM image at 50,000× showing the sensor (light gray stripes) with magnetic nanoparticle tags (white dots). (d–h) A schematic of the sandwich assay. (d) Capture antibodies (blue) that are complementary to a chosen antigen (yellow) are immobilized onto the surface of each sensor. (e) The noncomplementary antigens are subsequently washed away. (f) After adding a cocktail of detection antibodies, the biotinylated detection antibody (orange) complementary to the antigen of interest binds in a sandwich structure, and the noncomplementary antibodies are washed away. (g) Finally, a streptavidin-labeled magnetic nanoparticle tag is added to the solution, and it binds the biotinylated detection antibody. (h) As the magnetic tags diffuse to the GMR sensor surface and bind the detection antibody, the magnetic fields from the magnetic nanoparticles can be detected by the underlying GMR sensor in real-time in the presence of a small external modulation magnetic field.
Figure 2
Figure 2
Sensitivity and linear dynamic range (on a log-log plot) of magnetonanosensors and ELISA. (a) Superimposed serial dilution curves of CEA detection on the magnetic nanosensor and ELISA comparing the linear dynamic range and the lower limit of detection in 0.1% BSA in PBS (the same antibody pairs were used for both assays). μVrms is the unit of GMR sensor signal, whereas A450nm is the unit of ELISA. The background is defined as the average signal with no (0 ng ml-1) CEA spiked into the reaction well for each technology plus 2 s.d. The error bars represent means ± s.d. Inset, real-time monitoring of change in voltage over time when 5 fM CEA is spiked into the reaction well when compared to the BSA control and a noncomplementary antibody to survivin control (anti-survivin). The error bars represent means ± s.d. (b) Demonstration of protein detection using amplification to quantifiably distinguish (P < 0.05) protein concentrations in the attomolar concentration regime. NS indicates no significant difference in signal according to Welch's t test. The error bars represent means ± s.d.
Figure 3
Figure 3
Magnetonanosensors exhibit matrix-insensitive detection. (a) Sensor response to changes in media with surface-bound BSA and antibody to VEGF. The pH of the solution is plotted above the sensor response. (b) Sensor response to temperature changes before (top) and after (bottom) background temperature correction. The numbers at the top indicate the initial temperature of the solution that was loaded into the reaction well. An exponential decay is observed in the uncorrected signal due to equilibration of the sample toward room temperature. A detailed discussion on how the temperature correction works is presented in Supplementary Figure 2.(c,d) Comparison of calibration curves detecting CEA and VEGF when spiked into 0.1% BSA in PBS and into mouse serum. The calibration curves generated in the two media are virtually identical for both proteins. The error bars represent means ± s.d.
Figure 4
Figure 4
Multiplex protein detection in a diversity of media. (a) A panel of eight human tumor markers and a BSA negative control and epoxy control indicate matrix-insensitive protein detection when shifting from PBS to mouse serum to lysis buffer. No bar graph is shown for the 10 ng ml-1 GCSF spiked into mouse serum or 10 ng ml-1 of eotaxin spiked into PBS due to sensor corrosion during the experiment. The error bars represent means ± s.d. Ltf, lactoferrin. (b) Matrix-insensitive protein detection across a range of concentrations (0 ng ml-1 control, 0.1 ng ml-1 spiked samples and 10 ng ml-1 spiked samples) for CEA and Ltf in PBS, mouse serum and lysis buffer. In addition, detection of 10 ng ml-1 CEA and Ltf spiked in PBS, mouse serum, lysis buffer, human urine and human saliva is presented. The error bars represent means ± s.d.
Figure 5
Figure 5
Femtomolar-level multiplex tumor marker profiling in xenograft mice. Detection of CEA, EPCAM and VEGF in xenograft tumor-bearing mice. (a) Time-course detection of CEA in each mouse. The background bar in red indicates the average background signal plus 2 s.d. The error bars represent means ± s.d. (b) Time-course detection of EpCAM in mouse serum. (c) Time-course detection of VEGF in mouse serum.

Similar articles

Cited by

References

    1. Srinivas PR, et al. Proteomics in early detection of cancer. Clin Chem. 2001;47:1901–1911. - PubMed
    1. Lopez MF, et al. A novel, high-throughput workflow for discovery and identification of serum carrier protein-bound peptide biomarker candidates in ovarian cancer samples. Clin Chem. 2007;53:1067–1074. - PubMed
    1. Gorelik E, et al. Multiplexed immunobead-based cytokine profiling for early detection of ovarian cancer. Cancer Epidemiol Biomarkers Prev. 2005;14:981–987. - PubMed
    1. Zheng Y, et al. A multiparametric panel for ovarian cancer diagnosis, prognosis, and response to chemotherapy. Clin Cancer Res. 2007;13:6984–6992. - PubMed
    1. Heath JR, Davis ME. Nanotechnology and cancer. Annu Rev Med. 2008;59:251–265. - PMC - PubMed

Publication types

MeSH terms

Substances