. 2010 Jan;51(1):246-54.
doi: 10.1002/hep.23267.

Novel mechanisms of protection against acetaminophen hepatotoxicity in mice by glutathione and N-acetylcysteine

Affiliations

Novel mechanisms of protection against acetaminophen hepatotoxicity in mice by glutathione and N-acetylcysteine

Chieko Saito et al. Hepatology. 2010 Jan.

Abstract

Acetaminophen (APAP) overdose is a major cause of acute liver failure. The glutathione (GSH) precursor N-acetylcysteine (NAC) is used to treat patients with APAP overdose for up to 48 hours. Although it is well established that early treatment with NAC can improve the scavenging of the reactive metabolite N-acetyl-p-benzoquinone imine, protective mechanisms at later times remain unclear. To address this issue, fasted C3Heb/FeJ mice were treated with 300 mg/kg APAP and then received intravenously 0.65 mmol/kg GSH or NAC at 1.5 hours after APAP. The animals were sacrificed at 6 hours. APAP alone caused severe liver injury with peroxynitrite formation and DNA fragmentation, all of which was attenuated by both treatments. However, GSH (-82%) was more effective than NAC (-46%) in preventing liver injury. Using nuclear magnetic resonance spectroscopy to measure tissue adenosine triphosphate (ATP) levels and the substrate flux through the mitochondrial Krebs cycle, it was observed that the reduced liver injury correlated with accelerated recovery of mitochondrial GSH content, maintenance of ATP levels, and an increased substrate supply for the mitochondrial Krebs cycle compared with APAP alone. NAC treatment was less effective in recovering ATP and mitochondrial GSH levels and showed reduced substrate flux through the Krebs cycle compared with GSH. However, increasing the dose of NAC improved the protective effect similar to GSH, suggesting that the amino acids not used for GSH synthesis were used as mitochondrial energy substrates.

Conclusion: Delayed treatment with GSH and NAC protect against APAP overdose by dual mechanisms-that is, by enhancing hepatic and mitochondrial GSH levels (scavenging of reactive oxygen and peroxynitrite)-and by supporting the mitochondrial energy metabolism.


Figures

Figure 1
Figure 1
Plasma alanine aminotransferase (ALT) activities and the hepatic content of glutathione (GSH+GSSG) and glutathione disulfide (GSSG) were measured in control animals or mice treated with 300 mg/kg acetaminophen (APAP) for 6 h. The ratio between GSSG and total glutathione was calculated. Some of the animals received additionally 10 ml/kg saline, 0.65 mmol/kg GSH or 0.65 mmol/kg N-acetylcysteine (NAC) iv 1.5 h after APAP. Data represent means ± SE of n = 5 animals per group. *P<0.05 (compared to controls); #P<0.05 (compared to APAP/saline)
Figure 2
Figure 2
Histological assessment of liver injury (hematoxilin & eosin, H&E), peroxynitrite formation (nitrotyrosine staining) and DNA fragmentation (TUNEL assay) in control animals or mice treated with 300 mg/kg acetaminophen (APAP) for 6 h. Some of the animals received additionally 10 ml/kg saline, 0.65 mmol/kg GSH or 0.65 mmol/kg N-acetylcysteine (NAC) iv 1.5 h after APAP. The representative pictures show extensive centrilobular necrosis, which correlated with the areas of nitrotyrosine staining and TUNEL-positive cells in APAP-treated animals. Both, GSH and NAC treatment improved all parameters with GSH being more effective than NAC. (×100 for all panels)
Figure 3
Figure 3
Time course of hepatic glutathione (GSH+GSSG) levels (A) and plasma ALT activities (B) after treatment with 300 mg/kg APAP. Some animals received additionally 10 ml/kg saline, 0.65 mmol/kg GSH or 0.65 mmol/kg N-acetylcysteine (NAC) iv 1.5 h after APAP. Data represent means ± SE of n = 4 animals per time point. *P<0.05 (compared to APAP/saline); #P<0.05 (compared to APAP/GSH) C. Mitochondrial glutathione content in controls or 2.5 h after injection of APAP alone or in combination with GSH and NAC. Data represent means ± SE of n = 4 animals per group or time point. *P<0.05 (compared to controls, C); #P<0.05 (compared to APAP/GSH)
Figure 4
Figure 4
Tissue concentrations of ATP (μmol/g wet weight), as calculated from its resonances in 31P-NMR spectra of liver extracts. The mice were treated with 300 mg/kg APAP and some subsequently received 0.65 mmol/kg GSH or NAC at 1.5 h after APAP. ATP levels were measured 2.25 h (A) or 6.75 h (B) after treatment with APAP. Data represent means ± SE of n = 4 animals per group. *P<0.05 (compared to controls, C); #P<0.05 (compared to APAP/GSH)
Figure 5
Figure 5
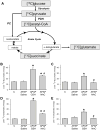
A. Labeling of glutamate from [U-13C]glucose. [U-13C]glucose is first metabolized to [3-13C]pyruvate, which is converted via pyruvate dehydrogenase (PDH) and pyruvate carboxylase (PC) to [2-13C]acetyl-CoA and [3-13C]oxaloacetate, respectively. The fluxes through PDH and PC lead to a different 13C-labeling pattern in the Krebs cycle intermediate citrate, and are finally measured by the isotopomer pattern of glutamate in 13C-NMR spectra. B-E. Concentrations of 13C-labelled [4,5-13C]glutamate and the Krebs cycle intermediate [2,3-13C]succinate (nmol/g wet weight), as calculated from their resonances in 1H- and 13C-NMR spectra of liver extracts. The mice were treated with 300 mg/kg APAP and some subsequently received 0.65 mmol/kg GSH or NAC at 1.5 h after APAP. Glutamate and succinate levels were measured 45 min after injection of [U-13C]glucose, i.e. at 2.25 h after APAP (B, D) or 45 min after injection of [U-13C]glucose, i.e. 6.75 h after APAP (C, E). Data represent means ± SE of n = 4 animals per group. *P<0.05 (compared to controls, C); #P<0.05 (compared to APAP/GSH)
Figure 6
Figure 6
A-B. Plasma alanine aminotransferase (ALT) activities and the hepatic content of glutathione (GSH+GSSG) were measured in mice treated with 300 mg/kg acetaminophen (APAP) for 6 h. Some of the animals received additionally 10 ml/kg saline, 0.65 mmol/kg N-acetylcysteine (l-NAC), 1.95 mmol/kg NAC (h-NAC), a mixture of 3 amino acids (0.65 mmol/kg of glycine, glutamic acid and NAC) (3AS) or a mixture of 2 amino acids (0.98 mmol/kg glycine and glutamic acid) (2AS) iv 1.5 h after APAP. Data represent means ± SE of n = 5 animals per group. *P<0.05 (compared to controls); #P<0.05 (compared to APAP/saline). C-D. Tissue concentrations of ATP (μmol/g wet weight), as calculated from its resonances in 31P-NMR spectra of liver extracts. The mice were treated as under A-B and ATP levels were measured 2.25 h (C) or 6.75 h (D) after treatment with APAP. Data represent means ± SE of n = 4 animals per group. *P<0.05 (compared to APAP/saline)

Similar articles

Cited by

References

    1. Larson AM, Polson J, Fontana RJ, Davern TJ, Lalani E, Hynan LS, et al. Acute Liver Failure Study Group. Acetaminophen-induced acute liver failure: results of a United States multicenter, prospective study. HEPATOLOGY. 2005;42:1364–1372. - PubMed
    1. Mitchell JR, Jollow DJ, Potter WZ, Gillette JR, Brodie BB. Acetaminophen-induced hepatic necrosis. IV. Protective role of glutathione. J Pharmacol Exp Ther. 1973;187:211–217. - PubMed
    1. Jollow DJ, Mitchell JR, Potter WZ, Davis DC, Gillette JR, Brodie BB. Acetaminophen-induced hepatic necrosis. II. Role of covalent binding in vivo. J Pharmacol Exp Ther. 1973;187:195–202. - PubMed
    1. Mitchell JR, Jollow DJ, Potter WZ, Davis DC, Gillette JR, Brodie BB. Acetaminophen-induced hepatic necrosis. I. Role of drug metabolism. J Pharmacol Exp Ther. 1973;187:185–194. - PubMed
    1. Prescott LF, Park J, Ballantyne A, Adriaenssens P, Proudfoot AT. Treatment of paracetamol (acetaminophen) poisoning with N-acetylcysteine. Lancet. 1977;2:432–434. - PubMed

Publication types

MeSH terms