. 2010 Apr;25(4):757-68.
doi: 10.1359/jbmr.091015.

Growth hormone regulates the balance between bone formation and bone marrow adiposity

Affiliations

Growth hormone regulates the balance between bone formation and bone marrow adiposity

Philip J Menagh et al. J Bone Miner Res. 2010 Apr.

Abstract

Cancellous bone decreases and bone marrow fat content increases with age. Osteoblasts and adipocytes are derived from a common precursor, and growth hormone (GH), a key hormone in integration of energy metabolism, regulates the differentiation and function of both cell lineages. Since an age-related decline in GH is associated with bone loss, we investigated the relationship between GH and bone marrow adiposity in hypophysectomized (HYPOX) rats and in mice with defects in GH signaling. HYPOX dramatically reduced body weight gain, bone growth and mineralizing perimeter, serum insulin-like growth factor 1 (IGF-1) levels, and mRNA levels for IGF-1 in liver and bone. Despite reduced body mass and adipocyte precursor pool size, HYPOX resulted in a dramatic increase in bone lipid levels, as reflected by increased bone marrow adiposity and bone triglyceride and cholesterol content. GH replacement normalized bone marrow adiposity and precursor pool size, as well as mineralizing perimeter in HYPOX rats. In contrast, 17beta -estradiol, IGF-1, thyroxine, and cortisone were ineffective. Parathyroid hormone (PTH) reversed the inhibitory effects of HYPOX on mineralizing perimeter but had no effect on adiposity. Finally, bone marrow adiposity was increased in mice deficient in GH and IGF-1 but not in mice deficient in serum IGF-1. Taken together, our findings indicate that the reciprocal changes in bone and fat mass in GH signaling-deficient rodents are not directly coupled with one another. Rather, GH enhances adipocyte as well as osteoblast precursor pool size. However, GH increases osteoblast differentiation while suppressing bone marrow lipid accumulation.


Figures

Fig. 1
Fig. 1
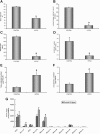
Effect of hypophysectomy (HYPOX) on body weight (A), longitudinal bone growth rate measured in the proximal tibia (B), serum insulin-like growth factor 1 (IGF-1) peptide (C), IGF-1 mRNA measured in liver (D), and triglyceride (E), cholesterol (F), and fatty acid composition (G) in total femur in weanling female rats (experiment 1). Values ± SE; n = 4 to 5 per group. aSignificantly different from control, p < .05.
Fig. 2
Fig. 2
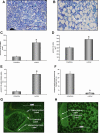
Effect of hypophysectomy (HYPOX) on bone marrow adiposity and mineralizing bone perimeter in weanling female rats (experiment 1). Representative micrographs show adipocytes in the proximal tibia of a control (A) and a HYPOX (B) rat. Note the increased adiposity in the HYPOX animal. Quantitative measurements were performed to obtain adipocyte number (C), adipocyte size (D), and adipocyte area/tissue area (E). Mineralizing perimeter (F) was measured, and representative micrographs show fluorochrome labels in a control (G) and a HYPOX (H) rat. Note the absence of the final (demeclocycline) label in the HYPOX rats. Values are mean ± SE; n = 5 per group. aSignificantly different from control, p < .01.
Fig. 3
Fig. 3
Reversibility of hypophysectomy (HYPOX)–induced skeletal abnormalities by GH in sexually mature female rats (experiment 2). The effects of HYPOX and GH replacement are shown for adipocyte area/tissue area (A, B) and mineralizing perimeter/bone perimeter (C, D). Adipocyte area was higher (A) and mineralizing perimeter was lower (C) in HYPOX compared with control rats at 10 days postoperatively. GH replacement was initiated in HYPOX rats on day 10 postoperatively. GH replacement normalized bone marrow adiposity (B) and mineralizing perimeter/bone perimeter (D) in HYPOX rats by postoperative day 25. Values are mean ± SE; n = 9 per group. aSignificantly different from control, p < .01.
Fig. 4
Fig. 4
Effect of treatment with 17β-estradiol (E2), insulin-like growth factor 1 (IGF-1), or growth hormone (GH) on uterine weight (A) and bone marrow adipocyte area/tissue area in the proximal tibia (B) in sexually mature hypophysectomized (HYPOX) female rats (experiment 3). Hormone replacement was started 10 days following HYPOX. Values are mean ± SE; n = 8 per group). aSignificantly different from control, p < .01.
Fig. 5
Fig. 5
Effect of treatment with growth hormone (GH) or intermittent parathyroid hormone (PTH) on mineralizing perimeter/bone perimeter (A), bone marrow adipocyte area/tissue area (B), adipocyte number (C), and adipocyte size (D) in the proximal tibia in sexually mature hypophysectomized (HYPOX) female rats (experiment 5). Hormone replacement was started 10 days following HYPOX. Note that PTH increased mineralizing perimeter but in contrast to GH had no effect on bone marrow adiposity. Values are mean ± SE; n = 5 to 6 per group. aSignificantly different from control, p < .01.
Fig. 6
Fig. 6
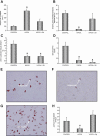
Effect of hypophysectomy (HYPOX) and growth hormone (GH) replacement on adipocyte number (A), mineralizing perimeter/bone perimeter (B), abdominal white adipose tissue (WAT) weight (C), and serum leptin (D) in sexually mature male rats (experiment 6). Values are mean ± SE; n = 5 to 7 per group. aSignificantly different from control, p < .01. Also shown are representative micrographs indicating adipocytes in cell culture from control (E), HYPOX (F), and HYPOX + GH (G) rats and adipocyte number/field (H). Values are mean ± SE; n = 6 replicates per group. aSignificantly different from control, p < .05.
Fig. 7
Fig. 7
Bone area and marrow adiposity in genetic models of impaired growth hormone (GH) signaling. Bone area/tissue area (A) and bone marrow adipocyte area/tissue area (B) in lit and LID mice and their respective wild-type (WT) littermates (experiment 7). Values are mean ± SE; n = 11 (lit and littermate control) or n = 4 (LID and littermate control). aSignificantly different from WT, p < .01.

References

    1. Nilsson A, Swolin D, Enerback S, Ohlsson C. Expression of functional growth hormone receptors in cultured human osteoblast-like cells. J Clin Endocrinol Metab. 1995;80:3483–3488. - PubMed
    1. Kasukawa Y, Miyakoshi N, Mohan S. The anabolic effects of GH/IGF system on bone. Curr Pharm Des. 2004;10:2577–2592. - PubMed
    1. Ohlsson C, Bengtsson BA, Isaksson OG, Andreassen TT, Slootweg MC. Growth hormone and bone. Endocr Rev. 1998;19:55–79. - PubMed
    1. Franco C, Bengtsson BA, Johannsson G. The GH/IGF-1 axis in obesity: physiological and pathological aspects. Metab Syndr Relat Disord. 2006;4:51–56. - PubMed
    1. Giustina A, Mazziotti G, Canalis E. Growth hormone, insulin-like growth factors, and the skeleton. Endocr Rev. 2008:535–539. - PMC - PubMed

Publication types

MeSH terms