. 2010 Apr;25(4):734-45.
doi: 10.1359/jbmr.091016.

Microdamage repair and remodeling requires mechanical loading

Affiliations

Microdamage repair and remodeling requires mechanical loading

Erik I Waldorff et al. J Bone Miner Res. 2010 Apr.

Abstract

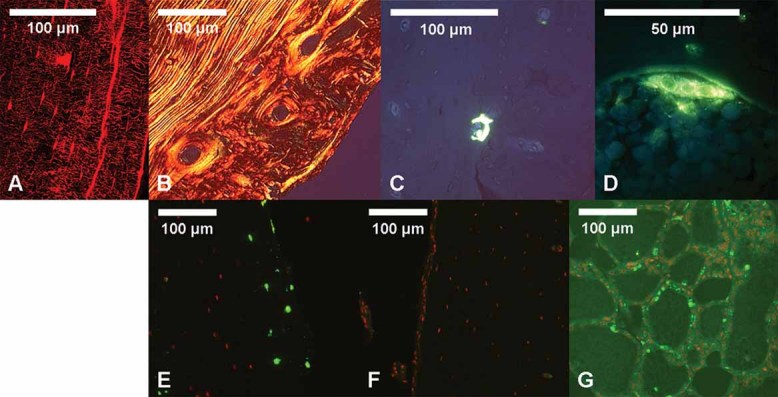
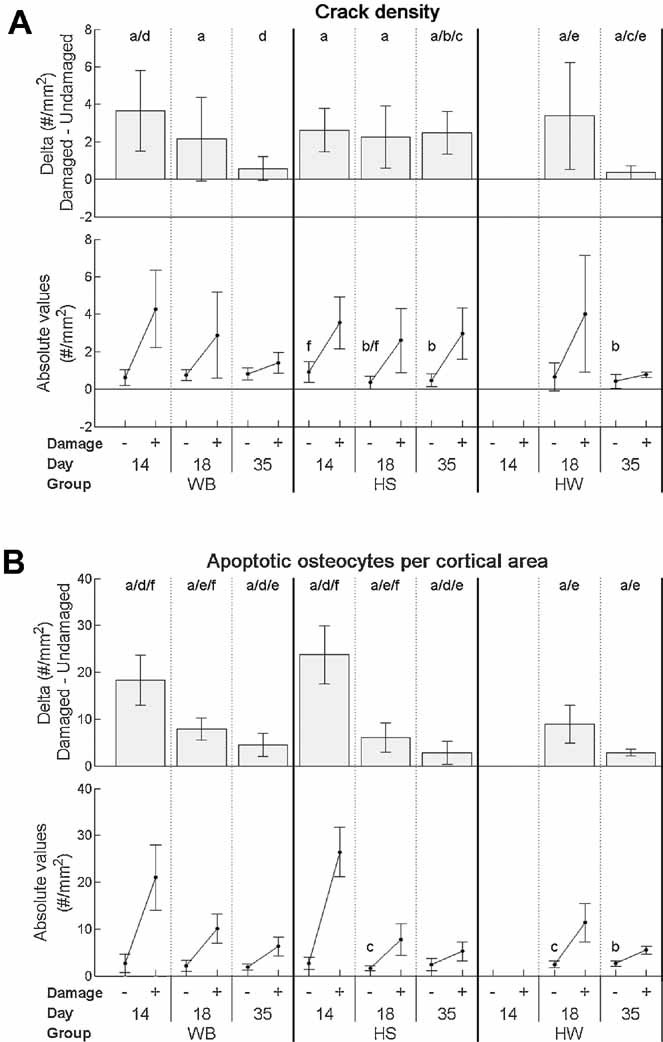
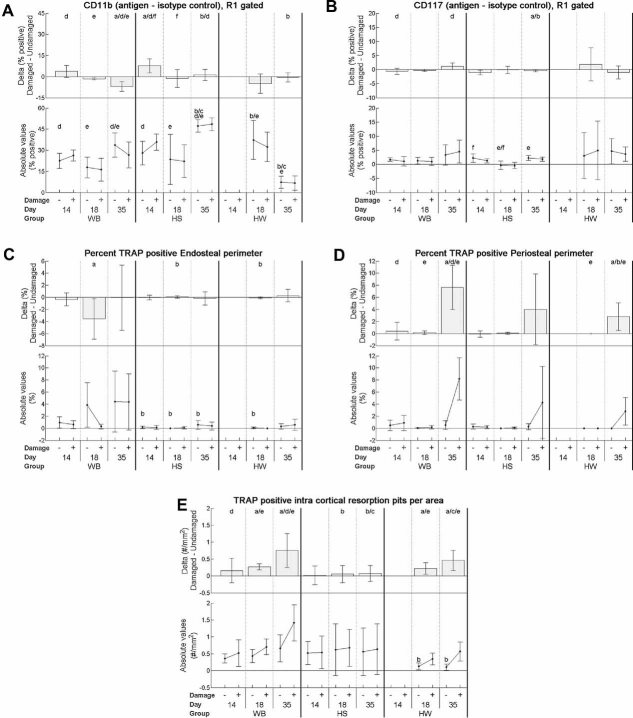
Bone remodeling is necessary to avoid microdamage accumulation, which could lead to whole-bone failure. Previous studies have shown that this bone-repair mechanism is triggered by osteocyte apoptosis. Through the use of a rodent hindlimb suspension model and tibial four-point bending model, the effects of disuse on microdamage remodeling was examined. At day 0, male rats were assigned to one of three groups: weight bearing (WB), hindlimb suspension (HS), or hindlimb suspension with daily intermittent weight bearing following damage-inducing loading (HW). Within each group, the rats were further divided into subgroups corresponding to three sacrifice time points [day 14 (WB and HS only), day 18, or day 35]. At day 14, animals were anesthetized, and their left tibiae underwent cyclic four-point bending to produce fatigue-induced microdamage. At sacrifice, the tibiae were examined using 3D micro-computed tomography (microCT), flow cytometry, and histologic and immunohistochemical stains. The results indicate that only the WB and HW groups had a significant increase in intracortical TRAP-positive resorption pits following damage induction, which was paralleled by a significant decrease in microdamage over time in combination with a shift in the osteoclast lineage owing to a decrease in monocytes. These results demonstrate that osteocyte apoptosis may be insufficient for repair of microdamage without the stimulation provided through physiologic loading. In addition, this potentially could have clinical implications for the current therapeutic paradigm for treating stress fractures, where extended non-weight bearing is employed.


Figures

Fig. 4
Fig. 4
Representative histologic images. (A) Confocal image of basic fuchsin–stained microdamage. (B) Polarized light microscopic image of picro–sirius red–stained woven and cortical bone. (C) Fluorescent microscopic image of ELF97 TRAP+ resorption pit. (D) Close-up fluorescent microscope image of ELF97 TRAP+ osteoclast. (E) Fluorescent microscope image of Apoptag-stained cortical bone with induced microdamage (from left-loaded tibia). Apoptotic osteocytes exhibit bright green fluorescence (wam). (F) Fluorescent microscope image of Apoptag-stained cortical bone without induced microdamage (from nonloaded contralateral right tibia). (G) Fluorescent microscope image of Apoptag-stained female rodent mammary glands serving as positive controls.
Fig. 1
Fig. 1
Cross-sectional parameters for undamaged (–) and damaged (+) tibiae. (A) Cortical area including woven bone determined from µCT. Animals per group (WB/HS/HW): Day 14 (13/14/–), day 18 (14/15/13), day 35 (14/17/13). (B) Woven bone area. Animals per group (WB/HS/HW): day 14 (6/7/–), day 18 (7/7/6), day 35 (7/8/6). Statistics: (a) Indicates significant difference between right versus left leg for that group on the particular day (i.e., Δ is significantly different from zero). (b) Indicates significant difference between WB and group on that day. (c) Indicates significant difference between HS and HW on that day. (e) Indicates significant difference between days 18 and 35 within the specific group (WB, HS, or HW). (f) Indicates significant difference between days 14 and 18 within the specific group (WB, HS, or HW). Error bars indicate standard deviations.
Fig. 2
Fig. 2
Microdamage parameters and associated osteocyte apoptosis for undamaged (–) and damaged (+) tibiae. (A) Crack density. Crack density was determined while omitting woven bone areas. Animals per group (WB/HS/HW): Day 14 (7/6/–), day 18 (7/8/7), day 35 (7/9/7). (B) Apoptotic osteocytes per cortical area. Number of apoptotic osteocytes (per cortical area) was determined while omitting woven bone areas. Animals per group (WB/HS/HW): Day 14 (6/7/–), day 18 (7/7/6), day 35 (7/8/6). Statistics: (a) Indicates significant difference between right versus left leg for that group on the particular day (i.e., Δ is significantly different from zero). (b) Indicates significant difference between WB and group on that day. (c) Indicates significant difference between HS and HW on that day. (d) Indicates significant difference between day 14 and day 35 within the specific group (WB, HS, or HW). (e) Indicates significant difference between days 18 and 35 within the specific group (WB, HS, or HW). (f) Indicates significant difference between days 14 and 18 within the specific group (WB, HS, or HW). Error bars indicate standard deviations.
Fig. 3
Fig. 3
Monocyte and HSC flow cytometry markers for tibial bone marrow and TRAP-stained parameters for undamaged (–) and damaged (+) tibiae. (A) CD11b, monocyte marker. (B) CD117, HSC marker. Animals per group for both CD11b/CD117 (WB/HS/HW): Day 14 (6/5/–), day 18 (3/4/7), day 35 (4/6/7). (C) Percent TRAP+ endosteal perimeter. (D) Percent TRAP+ periosteal perimeter. (E) TRAP+ resorption pits. Measurements were determined while omitting woven bone areas. Animals used per group for TRAP parameters (WB/HS/HW): Day 14 (6/7/–), day 18 (7/7/6), and day 35 (7/8/6). Statistics: (a) Indicates significant difference between right versus left leg for that group on the particular day (i.e., Δ is significantly different from zero). (b) Indicates significant difference between WB and group on that day. (c) Indicates significant difference between HS and HW on that day. (d) Indicates significant difference between day 14 and day 35 within the specific group (WB, HS, or HW). (e) Indicates significant difference between days 18 and 35 within the specific group (WB, HS, or HW). (f) Indicates significant difference between days 14 and 18 within the specific group (WB, HS, or HW). Error bars indicate standard deviations.

Similar articles

Cited by

References

    1. Riggs BL, Melton LJ., 3rd The worldwide problem of osteoporosis: insights afforded by epidemiology. Bone. 1995;17:505–511S. - PubMed
    1. Verborgt O, Gibson GJ, Schaffler MB. Loss of osteocyte integrity in association with microdamage and bone remodeling after fatigue in vivo. J Bone Miner Res. 2000;15:60–67. - PubMed
    1. Verborgt O, Tatton NA, Majeska RJ, Schaffler MB. Spatial distribution of Bax and Bcl-2 in osteocytes after bone fatigue: complementary roles in bone remodeling regulation? J Bone Miner Res. 2002;17:907–914. - PubMed
    1. Burr DB, Martin RB, Schaffler MB, Radin EL. Bone remodeling in response to in vivo fatigue microdamage. J Biomech. 1985;18:189–200. - PubMed
    1. Bentolila V, Boyce TM, Fyhrie DP, Drumb R, Skerry TM, Schaffler MB. Intracortical remodeling in adult rat long bones after fatigue loading. Bone. 1998;23:275–281. - PubMed

Publication types