. 2009 Oct;30(8):1462-75.
doi: 10.1111/j.1460-9568.2009.06944.x. Epub 2009 Oct 12.

GABAergic signaling induces divergent neuronal Ca2+ responses in the suprachiasmatic nucleus network

Affiliations

GABAergic signaling induces divergent neuronal Ca2+ responses in the suprachiasmatic nucleus network

Robert P Irwin et al. Eur J Neurosci. 2009 Oct.

Abstract

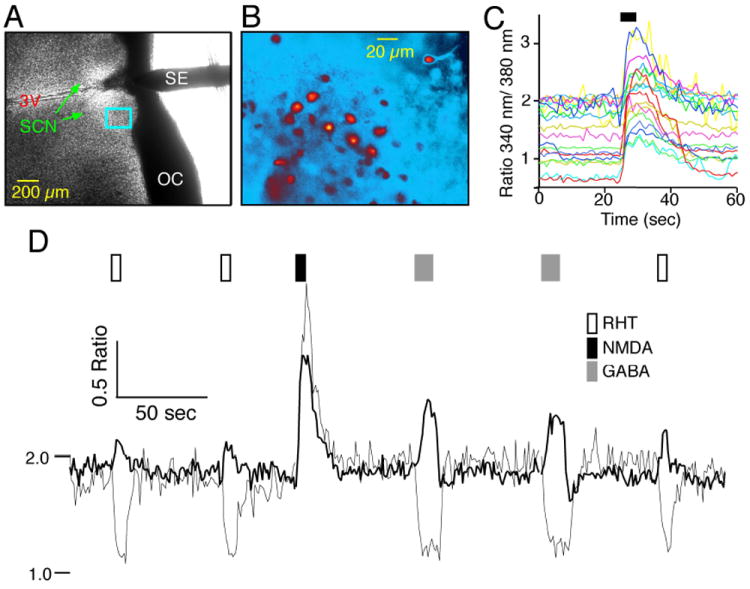
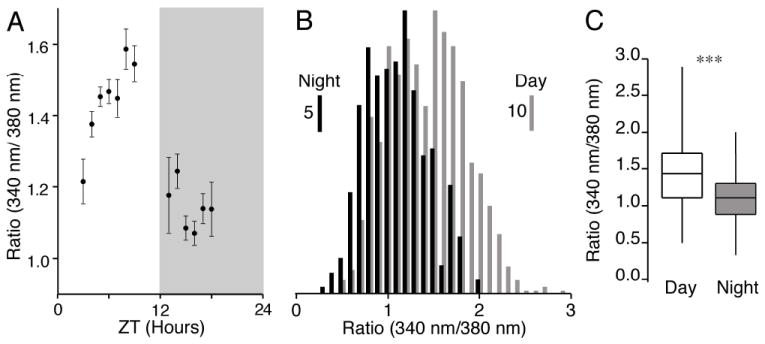
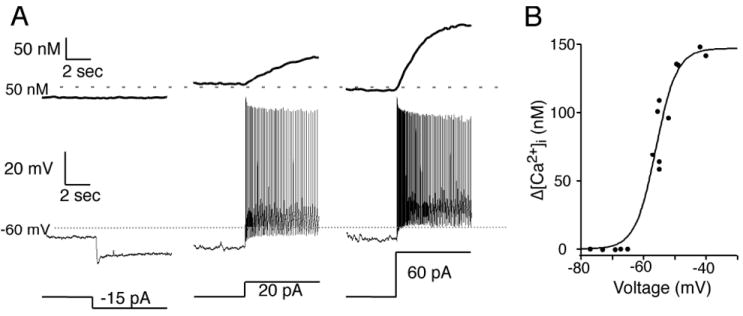
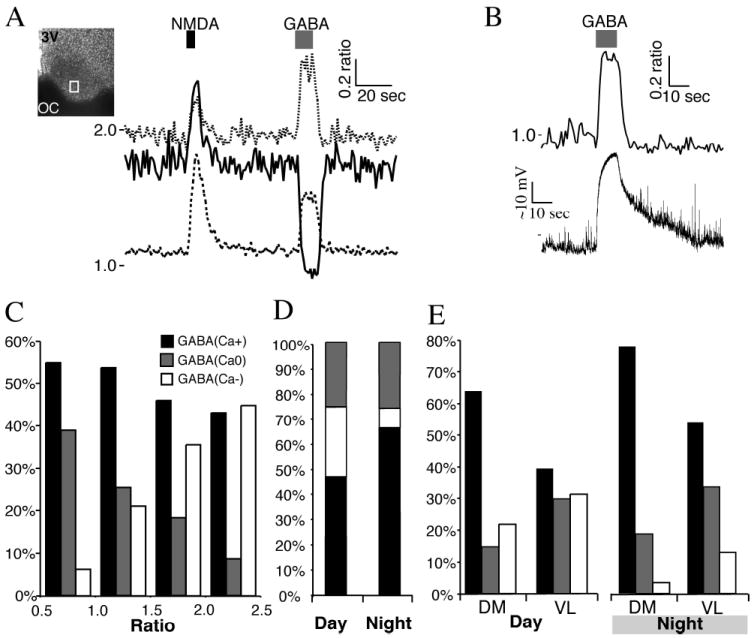
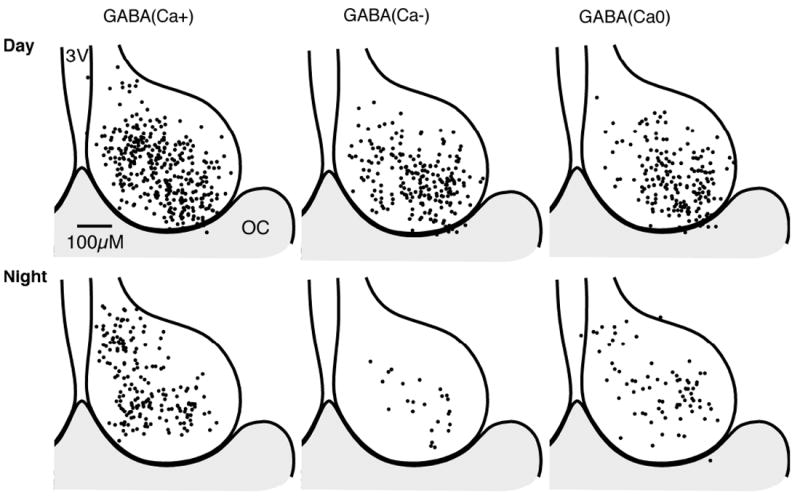
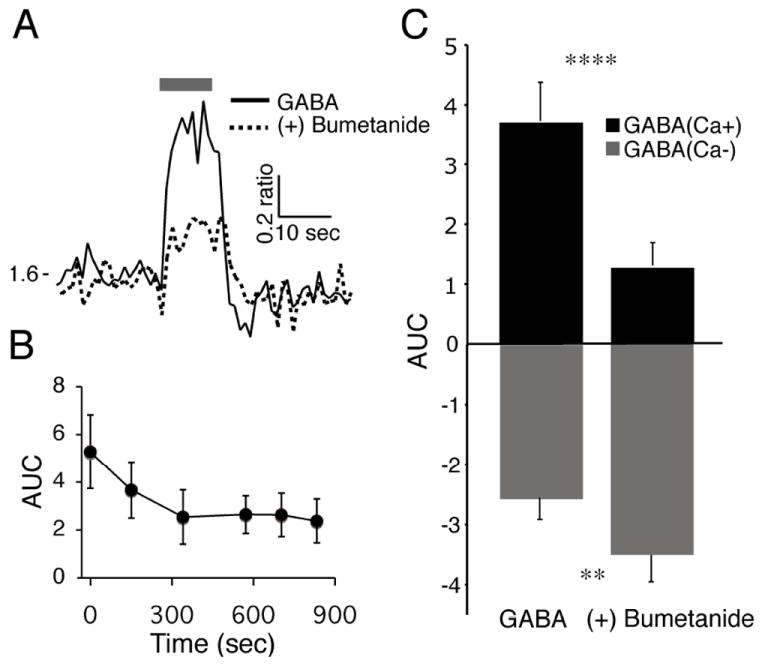
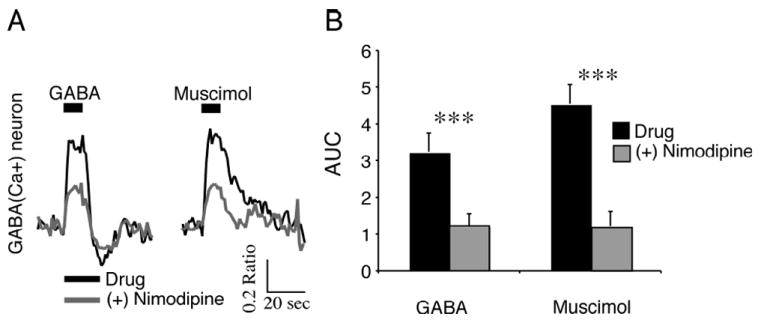
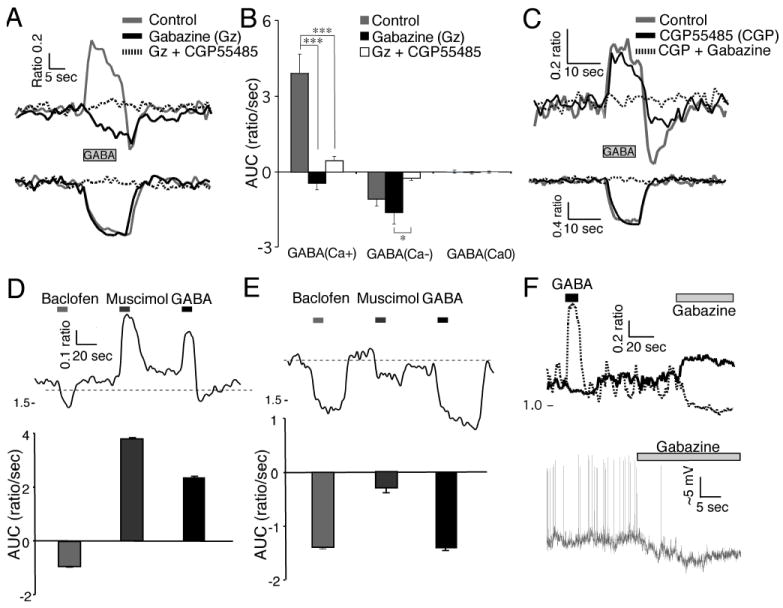
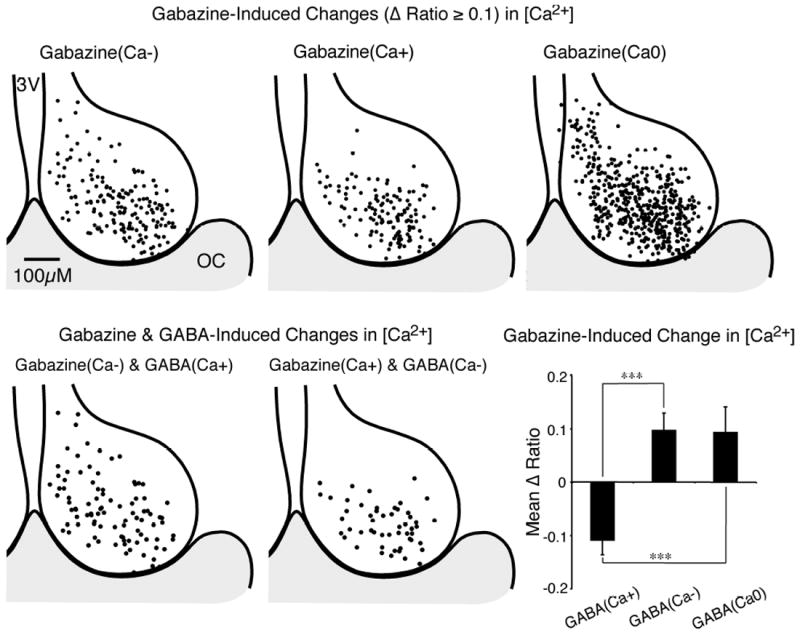
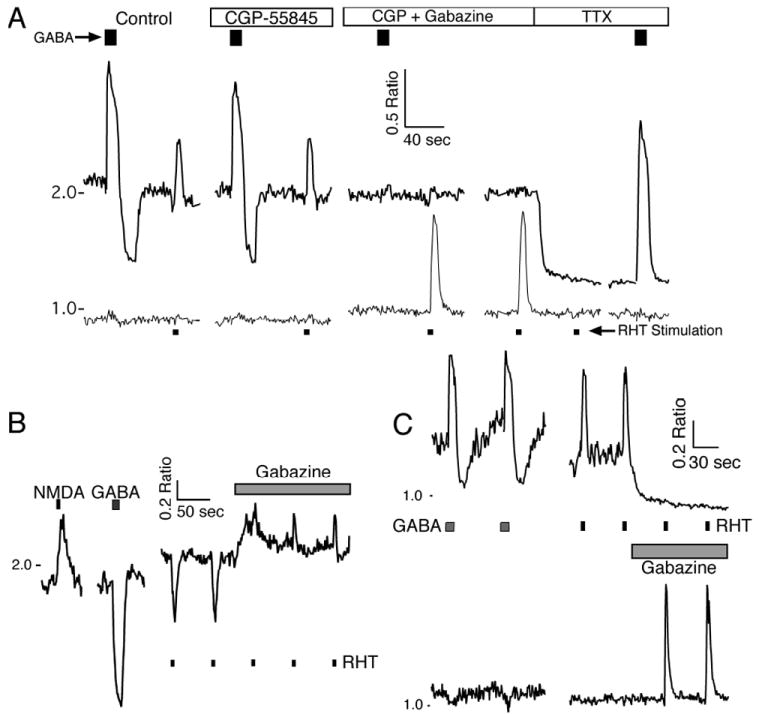
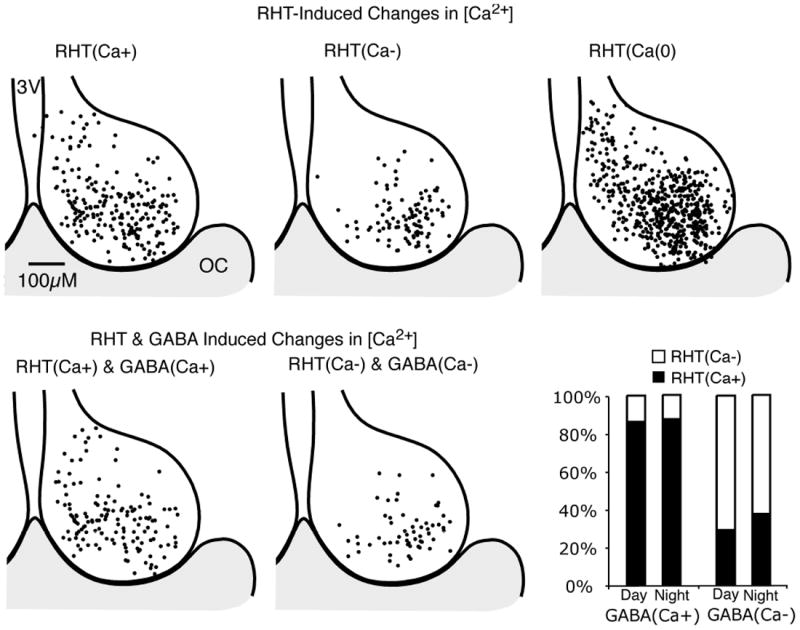
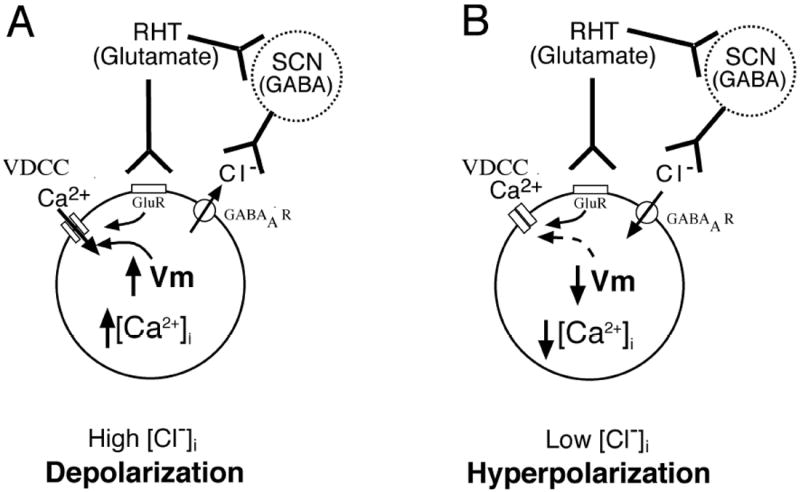
Intercellular communication between gamma-aminobutyric acid (GABA)ergic suprachiasmatic nucleus (SCN) neurons facilitates light-induced phase changes and synchronization of individual neural oscillators within the SCN network. We used ratiometric Ca(2+) imaging techniques to record changes in the intracellular calcium concentration ([Ca(2+)](i)) to study the role of GABA in interneuronal communication and the response of the SCN neuronal network to optic nerve stimulations that mimic entraining light signals. Stimulation of the retinohypothalamic tract (RHT) evoked divergent Ca(2+) responses in neurons that varied regionally within the SCN with a pattern that correlated with those evoked by pharmacological GABA applications. GABA(A) and GABA(B) receptor agonists and antagonists were used to evaluate components of the GABA-induced changes in [Ca(2+)](i). Application of the GABA(A) receptor antagonist gabazine induced changes in baseline [Ca(2+)](i) in a direction opposite to that evoked by GABA, and similarly altered the RHT stimulation-induced Ca(2+) response. GABA application induced Ca(2+) responses varied in time and region within the SCN network. The NKCC1 cotransporter blocker, bumetanide, and L-type calcium channel blocker, nimodipine, attenuated the GABA-induced rise of [Ca(2+)](i). These results suggest that physiological GABA induces opposing effects on [Ca(2+)](i) based on the chloride equilibrium potential, and may play an important role in neuronal Ca(2+) balance, synchronization and modulation of light input signaling in the SCN network.


Figures

Fig. 1
Fig. 1. Measurement of intracellular Ca2+ in the suprachiasmatic nucleus (SCN)
(A) Example of the recording setup showing a coronal hypothalamic slice containing the SCN and 3rd ventricle (3V) with a bipolar stimulating electrode (SE) used to stimulate the retinohypothalamic tract (RHT) positioned in the optic chiasm (OC). (B) Higher power fluorescent pseudo-color image of fura-2 AM-loaded SCN neurons located within the rectangle in (A). (C) N-methyl-d-aspartate (NMDA; 200 μm, 5 s) induced a transient increase in the Ca2+ ratio. Note the range of baseline Ca2+ ratios in these SCN neurons during the day (Zeitgeber time = 5 h). (D) Example showing postsynaptic Ca2+ in two SCN neurons with similar responses to NMDA (200 μm, 5 s), but divergent responses to stimulation of the RHT (100 pulses, 200 μs at 20 Hz) via a bipolar electrode placed in the OC (A) that paralleled the response to application of g-aminobutyric acid (GABA; 200 μm, 10 s).
Fig. 2
Fig. 2. SCN neuronal baseline Ca2+ is dependent on the time of day
(A) The mean baseline Ca2+ ratio varied with the time of the day. Each point represents the mean ± SEM of the Ca2+ ratio (total 1172 neurons, mean n = 90 and range 8–236 neurons) at the indicated times. The darkened box indicates the night phase. (B) Distribution of the baseline Ca2+ ratios in SCN neurons recorded during the day (n = 861) and night (n = 311), respectively. The scale bars indicate the number of cells in each bin. (C) A box plot of the data in (B) showing the range (vertical line), 25th and 75th percentiles (box) and median (horizontal line) for day and night SCN neurons. The variance in Ca2+ ratios significantly differed between the day and night (equality of variances F860,310 = 1.65, ***P < 0.0001), and were shifted higher during the day compared with night (Kolmogorov-Smirnov test χ22 = 104.8, ***P < 0.0001). ZT, Zeitgeber time.
Fig. 3
Fig. 3. The [Ca2+]i in SCN neurons varied with membrane potential and the spontaneous action potential firing frequency
(A) A SCN neuron recorded during the day with a microelectrode filled with an internal solution containing the Ca2+-sensitive probe bis-fura-2 and external ACSF containing picrotoxin (50 μm) was hyperpolarized to inhibit spontaneous action potentials (not shown) followed by small current steps (bottom trace) to further hyperpolarize or depolarize the membrane potential (middle trace). A reduction of membrane potential did not lower the estimated [Ca2+]i, while depolarizing steps produced a rapid increase in spontaneous action potential firing with a concomitant elevation of [Ca2+]i (top trace). (B) Summary of the neuron in (A) showing a sigmoid relationship between the voltage reached from each hyperpolarizing and depolarizing current step and the corresponding change in somatic [Ca2+]i. During action potential firing membrane voltage was estimated by a line halfway between the action potential threshold and peak of the afterhyperpolarization. Estimated [Ca2+]i was calculated as previously described (Irwin & Allen, 2007).
Fig. 4
Fig. 4. γ-Aminobutyric acid (GABA) induced divergent Ca2+ responses in SCN neurons
(A) SCN neurons imaged during the day, and treated with N-methyl-d-aspartate (NMDA; 200 μm, 5 s), which induced an increase in the Ca2+ ratio in all neurons. GABA (200 μm, 10 s) application induced divergent Ca2+ responses. The box within the SCN indicates the region recorded. Note the range of baseline Ca2+ concentrations. (B) Example of a GABA-induced rise in Ca2+ ratio and membrane depolarization in a SCN neuron recorded during the night using a loose-seal recording electrode. (C) The Ca2+ response to GABA (200 μm, 10 s) application varied with the baseline Ca2+ ratio. Ca2+ responses were separated into three groups: a transient elevation in the Ca2+ ratio [GABA(Ca+)]; a decrease in the Ca2+ ratio [GABA(Ca-)]; or no change in the Ca2+ ratio [GABA(Ca0)]. Data are the percentage of neurons in each response group based on the baseline Ca2+ ratio (range 0.5-1.0, n = 257 neurons; 1.0-1.5, n = 395; 1.5-2.0, n = 306; 2.0-2.5, n = 56). Note that the percentages of GABA(Ca-) and GABA(Ca0) neurons appeared reversed between low and high baseline Ca2+ ratios. (D) The percentage in the SCN neuronal response to GABA (200 μm, 10 s) varied between the day (n = 760) and night (n = 292). Note the change in the GABA(Ca+) and GABA(Ca-) groups, but not in the percentage of GABA(Ca0) neurons responding. (E) The percentage of SCN neurons with GABA-induced changes in the Ca2+ ratio varied between the dorsomedial (DM; n = 226 day and 145 night neurons) and ventrolateral (VL; n = 534 day and 147 night) regions of the SCN. The percentage of GABA(Ca+) neurons was higher in the DM during both the day and night. Conversely, the percentage of GABA(Ca-) and GABA(Ca0) neurons was higher in the VL in both day and night. 3V, 3rd ventricle; OC, optic chiasm.
Fig. 5
Fig. 5. γ-Aminobutyric acid (GABA)-induced Ca2+ responses of SCN neurons varied regionally
Regional and time of day variation of GABA-induced Ca2+ responses in SCN neurons (see Fig. 4D and E). The position for each neuron is superimposed on a representative drawing of the SCN, with the 3rd ventricle (3V) on the left and optic chiasm (OC) at the bottom. Note that while the number of cells in the day and night were not equal, the relative proportions varied between the day and the night.
Fig. 6
Fig. 6. Blocking the chloride cotransporter NKCC1 attenuated the γ-aminobutyric acid (GABA)-induced elevation of Ca2+
(A) Example of the Ca2+ response in a SCN neuron loaded with fura-2 AM and treated with GABA (200 μm, 10 s) during the day before and after bumetanide (10 μm, > 300 s) application. (B) The maximal bumetanide attenuation of the GABA-induced Ca2+ transient required > 300 s of treatment. The y-axis represents the area under the Ca2+ ratio curve [AUC (Ca2+ ratio/s), mean ± SEM] during the first 10 s of GABA treatment in 13 GABA(Ca+) neurons. (C) Bumetanide attenuated GABA-induced Ca2+ transients in GABA(Ca+) neurons and further reduced the Ca2+ ratio in GABA(Ca-) neurons. Data are the mean ± SEM of the AUC (0-10 s) of three different SCN slices for GABA(Ca+) (n = 39, t38 = 5.80, ****P < 0.00001) and GABA(Ca-) (n = 29, t28 = 2.89, **P = 0.007) SCN neurons before and after treatment with bumetanide (> 300 s).
Fig. 7
Fig. 7. Blocking L-type voltage-dependent Ca2+ channels attenuated γ-aminobutyric acid (GABA)-induced increases of [Ca2+]i
(A) Ca2+ responses induced by GABA (200 μm, 10 s) or muscimol (50 μm, 10 s) in a GABA(Ca+) neuron during the day before and after nimodipine (20 μM) application. Both GABA- and muscimol-induced Ca2+ transients were attenuated. (B) Nimodipine attenuated GABA- and muscimol-induced Ca2+ transients in GABA(Ca+) neurons. Data are the mean ± SEM of the area under the curve (AUC; Ca2+ ratio/s over 0-10 s of GABA treatment) for GABA(Ca+) (n = 30, t29 = 6.03 GABA, t29 = 10.6 muscimol, ***P < 0.00001) SCN neurons.
Fig. 8
Fig. 8. γ-Aminobutyric acid (GABA)A and GABAB receptor-mediated components of the GABA-induced Ca2+ response
(A) GABA (200 μm, 10 s) induced Ca2+ responses before and during treatment with gabazine (10 μm) followed by gabazine together with CGP55485 (3 μm) in a GABA(Ca+) (top) and GABA(Ca-) (bottom) neuron. Note that the addition of gabazine in this GABA(Ca-) neuron did not attenuate the GABA-induced reduction in Ca2+. (B) Gabazine inhibited the GABA-induced rise of Ca2+ but did not alter the GABA-induced reduction of Ca2+. Simultaneous inhibition of GABAA and GABAB receptors eliminated the GABA-induced Ca2+ changes. Data are the mean ± SEM of the area under the curve (AUC; Ca2+ ratio/s over 0-10 s of GABA treatment) of neurons (GABA(Ca+) (n = 19, F2,36 = 28.91, P < 0.0001, power = 1.00); GABA(Ca-) (n = 12, F2,22 = 6.56, P = 0.0058, power 0.875); GABA(Ca0) (n = 4, F2,6 = 0.198, P = 0.826, power = 0.069) from three different SCN slices with repeated-measures anova analysis and post hoc Bonferroni t-test adjusted for three comparisons [(GABA(Ca+) ***P < 0.0001, Gz vs. Gz + CGP55485 P = 0.46; GABA(Ca-) control vs. Gz P = 0.49, control vs. Gz + CGP55485 P = 0.13, *P = 0.0048). (C) Example showing GABA-induced Ca2+ response during CGP55485 application followed by CGP55485 together with gabazine in GABA(Ca+) (top) and GABA(Ca-) (bottom) neurons. Note that the addition of gabazine in this GABA(Ca-) neuron eliminated the GABA-induced reduction in Ca2+. (D) Effects of baclofen (10 μm), muscimol (50 μm) and GABA (200 μM) on GABA(Ca+) neurons. The top trace is an example of Ca2+ responses in a GABA(Ca+) neuron. Below is the mean ± SEM of the AUC in 69 GABA(Ca+) neurons. (E) Effects of baclofen, muscimol and GABA as in (D), but with GABA(Ca-) neurons. Below is the mean ± SEM of the Ca2+ change in 21 GABA(Ca-) neurons. (F) The top traces show GABA- and gabazine-induced changes in the baseline Ca2+ ratio in two SCN neurons during the night. Gabazine induced a reduction in the baseline Ca2+ ratio in the GABA(Ca+) neuron (dashes) and an elevation of the baseline Ca2+ ratio in the GABA(Ca-) neuron (solid). The bottom trace shows an example of gabazine-induced hyperpolarization in a GABA(Ca+) SCN neuron during the night recorded using a loose-seal recording electrode.
Fig. 9
Fig. 9. Inhibiting endogenous γ-aminobutyric acid (GABA)A alters [Ca2+]i in SCN neurons
(Top) Regional variation of gabazine-induced (10 μm) changes in baseline Ca2+ ratio in SCN neurons. Responses were separated into three groups: a decrease of the Ca2+ ratio [gabazine(Ca-), top-left]; an increase of the Ca2+ ratio [gabazine(Ca+), top-middle]; and a non-responsive group Ca2+ [gabazine(Ca0), top-right]. The position for each neuron was superimposed on a representative drawing of the SCN, with the 3rd ventricle (3V) on the left and optic chiasm (OC) at the bottom. (Bottom left) Regional localization of individual SCN neurons with a GABA (200 μm)-induced increase in Ca2+ and a gabazine-induced decrease in Ca2+ (see Figs 5 and 8F). (Bottom middle) Regional variation of individual SCN neurons demonstrating both a GABA-induced decease and a gabazine-induced increase of [Ca2+]i. (Bottom right) The mean change in the baseline Ca2+ ratio produced by gabazine was in an opposite direction to the Ca2+ response evoked by GABA. Data are the mean ± SEM of the Ca2+ ratio change in gabazine-responsive neurons for GABA(Ca+) (n = 125), GABA(Ca-) (n = 77) and GABA(Ca0) (n = 65) neurons (F2,264 = 14.74, P < 0.0001, power = 1.00) by anova with Bonferroni t-tests adjusted for three comparisons, ***P < 0.0001. Note that GABA(Ca-) and GABA(Ca0) respond similarly (P = 1).
Fig. 10
Fig. 10. Retinohypothalamic tract (RHT) stimulation induces a range of postsynaptic Ca2+ responses
Stimulation of the RHT (100 pulses, 200 μs at 20 Hz) via a bipolar electrode placed in the optic chiasm (Fig. 1A) induced a transient elevation in Ca2+ [RHT(Ca+)], a transient reduction in Ca2+ [RHT(Ca-)] or no alteration in the Ca2+ ratio [RHT(Ca0)]. (A) The Ca2+ response to RHT stimulation and g-aminobutyric acid (GABA; 200 μm, 10 s) in two SCN neurons recorded during the day. CGP55845 (3 μm) application did not alter the RHT-induced Ca2+ signal in either cell, but the addition of gabazine (10 μm) eliminated the RHT-induced Ca2+ transient in the GABA(Ca+) neuron and induced a RHT-evoked Ca2+ response and a small elevation in the baseline Ca2+ ratio in the GABA(Ca0) neuron. Tetrodotoxin (TTX; 0.5 μm) eliminated the RHT-induced Ca2+ transients in both neurons. Note that GABA induced a biphasic Ca2+ response in the neuron with the higher baseline Ca2+ ratio (top trace), and the GABAB blocker reduced the duration of the later phase. Blocking both GABAA and GABAB eliminated both phases, and TTX reduced the baseline Ca2+ ratio but did not eliminate the rise in Ca2+ induced by GABA. (B) Example of a RHT(Ca-) response in a GABA(Ca-) SCN neuron during the day. Gabazine elevated the baseline Ca2+ and changed the direction of the RHT-induced Ca2+ response [RHT-Gz(Ca+)]. (C) Example showing the Ca2+ response following RHT stimulation in GABA(Ca+) and GABA(Ca-) neurons recorded during the night. Gabazine lowered the baseline Ca2+ in the GABA(Ca+) neuron and eliminated the RHT-induced transient elevation of Ca2+ [RHT-Gz(Ca-)]. In contrast, gabazine increased the RHT-induced Ca2+ elevation in a GABA(Ca-) neuron. NMDA, N-methyl-d-aspartate.
Fig. 11
Fig. 11. Regional variation of retinohypothalamic tract (RHT) stimulation induced Ca2+ transients in the SCN
(Top) Regional variation in Ca2+ responses following optic chiasm (OC) stimulation (100 pulses at 20 Hz). Responses were separated into three groups: a transient elevation in Ca2+ [RHT(Ca+)]; a reduction [RHT(Ca-)]; and no alteration in the Ca2+ ratio [RHT(Ca0)]. The position for each neuron was superimposed on a representative drawing of the SCN, with the 3rd ventricle (3V) on the left and OC at the bottom. The distribution appears similar to that of the Ca2+ response to GABA (Fig. 5). (Bottom left) Regional variation of individual SCN neurons that showed both a RHT stimulation-induced and GABA-induced (200 μm) increase in Ca2+. (Bottom middle) Regional variation of individual SCN neurons with a RHT- and GABA-induced decease of Ca2+. (Bottom right) The percentage of GABA(Ca+) (day n = 94, night n = 71) and GABA(Ca-) (day n = 76, night n = 8) SCN neurons also responding to RHT stimulation.
Fig. 12
Fig. 12. Theoretical model of glutamatergic light input signaling to the g-aminobutyric acid (GABA)ergic suprachiasmatic nucleus (SCN) network
The effect of GABA on membrane potential and [Ca2+]i is a balance, with excitatory and inhibitory effects of GABA neurotransmission within the network driven by the chloride gradient that is under control by the cotransporters, NKCC1 and KCC2. (A) Depolarization induced by external light input signaling to glutamate receptors (GluR) via the retinohypothalamic tract (RHT) is facilitated by GABA release from other SCN neurons (dashed circle) within the network to a SCN neuron (solid circle) with a high intercellular chloride concentration ([Cl-]i), where opening of GABAA receptors (GABAAR) moves Cl- out of the neuron, further depolarizing the membrane potential (Vm), opening voltage-dependent calcium channels (VDCC) and increasing [Ca2+]i. (B) In neurons with low baseline [Cl-]i, GABA released from the SCN network opens GABAAR and moves Cl- into the neuron hyperpolarizing the cell beyond the depolarizing effect of RHT signaling and decreasing [Ca2+]i. A balance may also occur between the depolarizing action of RHT light input signaling with a hyperpolarizing effect from GABA release within the network, and no change in membrane potential, firing frequency or [Ca2+]i occurs.

Comment in

Similar articles

Cited by

References

    1. Albus H, Vansteensel MJ, Michel S, Block GD, Meijer JH. A GABAergic mechanism is necessary for coupling dissociable ventral and dorsal regional oscillators within the circadian clock. Curr Biol. 2005;15:886–893. - PubMed
    1. Aton SJ, Colwell CS, Harmar AJ, Waschek J, Herzog ED. Vasoactive intestinal polypeptide mediates circadian rhythmicity and synchrony in mammalian clock neurons. Nature neuroscience. 2005;8:476–483. - PMC - PubMed
    1. Aton SJ, Herzog ED. Come together, right…now: synchronization of rhythms in a mammalian circadian clock. Neuron. 2005;48:531–534. - PMC - PubMed
    1. Belenky MA, Sagiv N, Fritschy JM, Yarom Y. Presynaptic and postsynaptic GABAA receptors in rat suprachiasmatic nucleus. Neuroscience. 2003;118:909–923. - PubMed
    1. Belenky MA, Yarom Y, Pickard GE. Heterogeneous expression of gamma-aminobutyric acid and gamma-aminobutyric acid-associated receptors and transporters in the rat suprachiasmatic nucleus. The Journal of comparative neurology. 2008;506:708–732. - PubMed

Publication types

MeSH terms