. 2009 Oct;30(8):1517-26.
doi: 10.1111/j.1460-9568.2009.06939.x. Epub 2009 Oct 12.

Segregation of short-wavelength-sensitive (S) cone signals in the macaque dorsal lateral geniculate nucleus

Affiliations

Segregation of short-wavelength-sensitive (S) cone signals in the macaque dorsal lateral geniculate nucleus

Sujata Roy et al. Eur J Neurosci. 2009 Oct.

Abstract

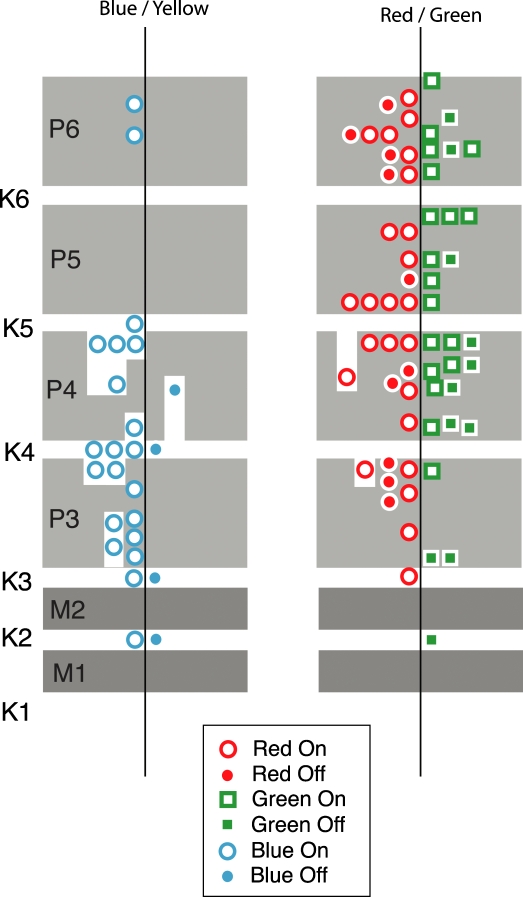
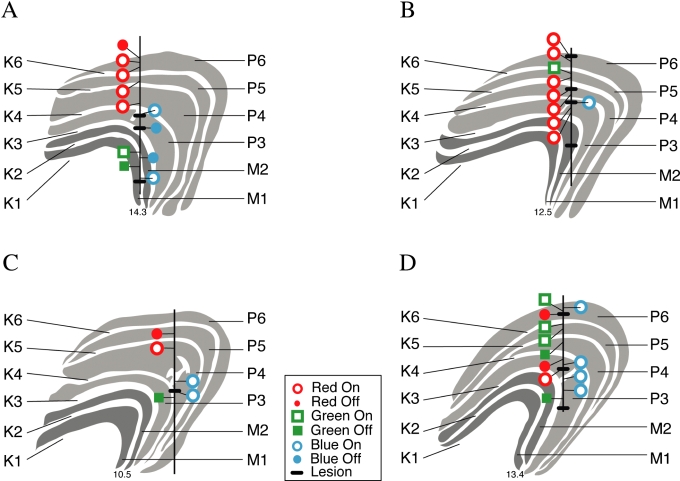
An important problem in the study of the mammalian visual system is whether functionally different retinal ganglion cell types are anatomically segregated further up along the central visual pathway. It was previously demonstrated that, in a New World diurnal monkey (marmoset), the neurones carrying signals from the short-wavelength-sensitive (S) cones [blue-yellow (B/Y)-opponent cells] are predominantly located in the koniocellular layers of the dorsal lateral geniculate nucleus (LGN), whereas the red-green (R/G)-opponent cells carrying signals from the medium- and long-wavelength-sensitive cones are segregated in the parvocellular layers. Here, we used extracellular single-unit recordings followed by histological reconstruction to investigate the distribution of color-selective cells in the LGN of the macaque, an Old World diurnal monkey. Cells were classified using cone-isolating stimuli to identify their cone inputs. Our results indicate that the majority of cells carrying signals from S-cones are located either in the koniocellular layers or in the 'koniocellular bridges' that fully or partially span the parvocellular layers. By contrast, the R/G-opponent cells are located in the parvocellular layers. We conclude that anatomical segregation of B/Y- and R/G-opponent afferent signals for color vision is common to the LGNs of New World and Old World diurnal monkeys.


Figures

F<sc>ig</sc> 1
Fig 1
Sequence of digital image processes carried out on (A) a Nissl-stained section to define the koniocellular layers and their ‘bridges’ within the LGN. (B) After applying a Gaussian filter to remove the higher spatial frequencies, (C) the low-frequency regions are segmented using an ‘opening’ filter. (D) This image is superimposed as the blue channel of the original image. The arrowheads in A indicate the paths of two electrode tracks. The black filled arrowhead indicates the site of an electrolytic lesion. The small yellow arrowheads in C indicate two koniocellular ‘bridges’ spanning the external parvocellular layers and the large white arrowheads show the positions of three B/Y cells encountered on the electrode path indicated in A.
F<sc>ig</sc> 2
Fig 2
Classification of LGN cells. Each column shows spatial frequency transfer functions for one cell of the indicated response type. Each row shows responses to one stimulus type. The top row shows responses to stimuli modulating only the S-cones and the second row shows responses to achromatic gratings modulating all three cone types in additive phase. The lower row shows responses to R/G (L–M) chromatic modulation. The temporal frequency of the drift was 4 Hz and the orientation was optimised for each cell. The cone contrasts for each stimulus are shown in Table 1. The insets show PSTHs made with a bin width of 10 ms from the response to a low (0.01 cycles/deg) spatial frequency condition in each panel. The phase of Blue On cell responses to achromatic stimuli could be either On or Off and, in this cell, it is Off. The abscissa is 0.25 s and the ordinate 10 impulses/s. The horizontal grey lines show the amplitude of the f1 component of the FFT in the absence of spatial contrast.
F<sc>ig</sc> 3
Fig 3
Contrast sensitivity functions for a Blue On cell and a Blue Off cell (same cell as in Fig. 2) for achromatic gratings (bottom row) along with their responses at different spatial frequencies for S-cone-isolating and achromatic gratings (top two rows). The drift frequency used was 4 Hz for both cells. The contrast sensitivity functions were done at the optimal spatial frequency and direction of movement for each cell. The grey horizontal lines show the amplitude of the f1 component of the FFT in the absence of spatial contrast.
F<sc>ig</sc> 4
Fig 4
Relationships between centre radius (rc), surround radius (rs), centre sensitivity (Kc), surround sensitivity (Ks) and visual field eccentricity for R/G and B/Y cells. Radii are in degrees and sensitivity in impulses/s/deg2.
F<sc>ig</sc> 6
Fig 6
Pooled data of the laminar distribution of cell types within the LGN from all four monkeys (n=88). The cells are placed along the schematised depth of the LGN, roughly proportionate to their distance from the immediately ventral koniocellular layer. In the left panel, the B/Y cells are shown with Blue On cells left of the vertical line and Blue Off cells to the right. In the right panel, R/G cells are shown with Red On and Red Off left of the vertical line and Green On and Green Off to the right. Where cells were localised in the koniocellular bridges in the parvocellular layers, such bridges are shown in the figure along with the cells localised within them. All except six cells (three R/G-opponent and three B/Y-opponent) were localized in the expected eye-specific layer.
F<sc>ig</sc> 5
Fig 5
Electrode tracks, one from each of the four animals, with locations of the functionally identified cells, reconstructed from three or four Nissl-stained sections. The koniocellular extensions into the parvocellular layers (into P3 in A, B and D and P4 in C) near the electrode tracks are shown, but not all such koniocellular bridges in the sections are shown in the figure. The inset provides the key for cell types. The horizontal black lines on the electrode tracks indicate the sites of electrolytic lesions.
F<sc>ig</sc> 7
Fig 7
Distribution of latencies of R/G-opponent and B/Y-opponent LGN cells to electrical stimulation from electrodes placed to straddle the optic chiasm. The inset provides the key to cell type (R/G- or B/Y-opponent) and latency to electrical stimulation of either ipsilateral or contralateral optic chiasm.

Similar articles

Cited by

References

    1. Ahmad A, Spear PD. Effects of aging on the size, density, and number of rhesus monkey lateral geniculate neurons. J. Comp. Neurol. 1993;334:631–643. - PubMed
    1. Blessing EM, Solomon SG, Hashemi-Nezhad M, Morris BJ, Martin PR. Chromatic and spatial properties of parvocellular cells in the lateral geniculate nucleus of the marmoset (Callithrix jacchus) J. Physiol. 2004;557:229–245. - PMC - PubMed
    1. Brainard DH. The Psychophysics Toolbox. Spat. Vis. 1997;10:443–446. - PubMed
    1. Casagrande VA, Royal DW, Sáry G. Extraretinal inputs and feedback mechanisms to the lateral geniculate nucleus (LGN) In: Kremers J, editor. The Primate Visual System: A Comparative Approach. Hoboken, New Jersey: John Wiley & Sons; 2005. pp. 191–211.
    1. Chatterjee S, Callaway EM. Parallel colour-opponent pathways to primary visual cortex. Nature. 2003;426:668–671. - PubMed

Publication types

MeSH terms