Comparative Study
. 2009;10(10):R111.
doi: 10.1186/gb-2009-10-10-r111. Epub 2009 Oct 12.

Genome-wide comparative analysis of the Brassica rapa gene space reveals genome shrinkage and differential loss of duplicated genes after whole genome triplication

Affiliations
Comparative Study

Genome-wide comparative analysis of the Brassica rapa gene space reveals genome shrinkage and differential loss of duplicated genes after whole genome triplication

Jeong-Hwan Mun et al. Genome Biol. 2009.

Abstract

Background: Brassica rapa is one of the most economically important vegetable crops worldwide. Owing to its agronomic importance and phylogenetic position, B. rapa provides a crucial reference to understand polyploidy-related crop genome evolution. The high degree of sequence identity and remarkably conserved genome structure between Arabidopsis and Brassica genomes enables comparative tiling sequencing using Arabidopsis sequences as references to select the counterpart regions in B. rapa, which is a strong challenge of structural and comparative crop genomics.

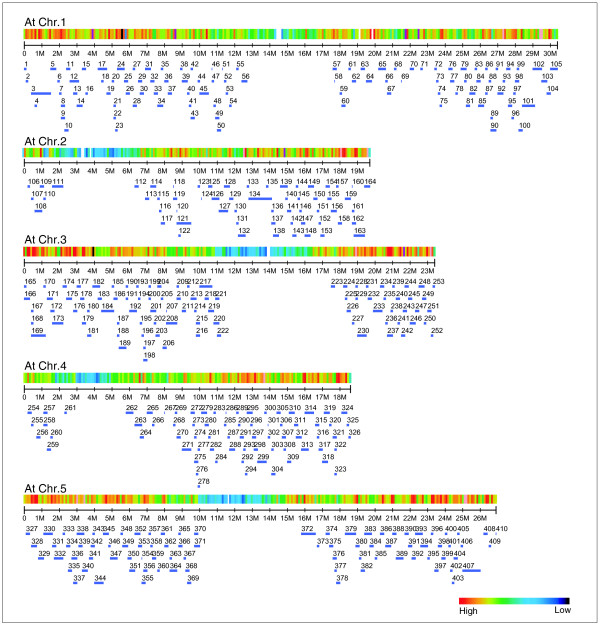
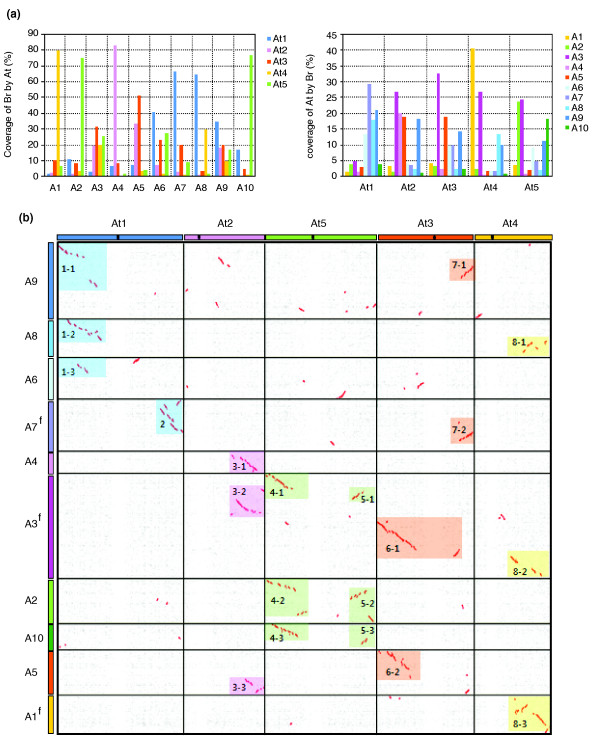
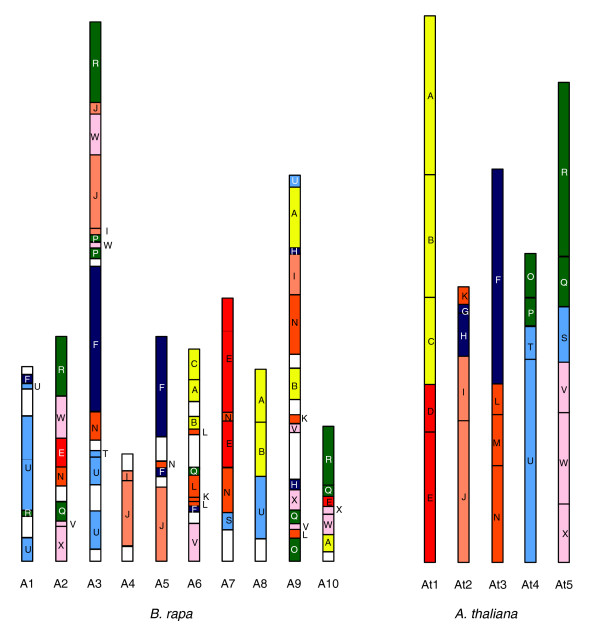
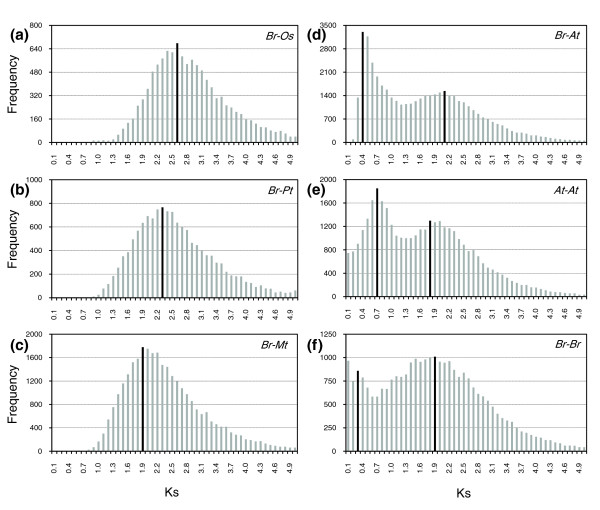
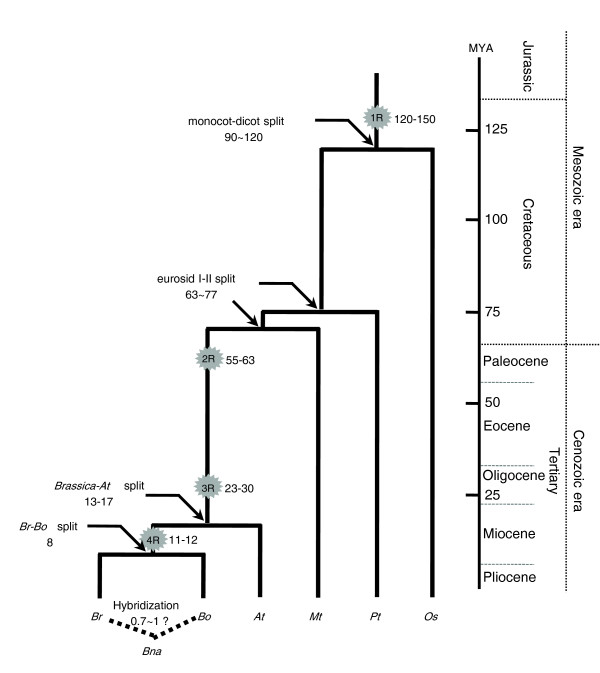
Results: We assembled 65.8 megabase-pairs of non-redundant euchromatic sequence of B. rapa and compared this sequence to the Arabidopsis genome to investigate chromosomal relationships, macrosynteny blocks, and microsynteny within blocks. The triplicated B. rapa genome contains only approximately twice the number of genes as in Arabidopsis because of genome shrinkage. Genome comparisons suggest that B. rapa has a distinct organization of ancestral genome blocks as a result of recent whole genome triplication followed by a unique diploidization process. A lack of the most recent whole genome duplication (3R) event in the B. rapa genome, atypical of other Brassica genomes, may account for the emergence of B. rapa from the Brassica progenitor around 8 million years ago.

Conclusions: This work demonstrates the potential of using comparative tiling sequencing for genome analysis of crop species. Based on a comparative analysis of the B. rapa sequences and the Arabidopsis genome, it appears that polyploidy and chromosomal diploidization are ongoing processes that collectively stabilize the B. rapa genome and facilitate its evolution.


Figures

Figure 1
Figure 1
In silico allocation of 410 B. rapa BAC sequence contigs to A. thaliana chromosomes. BAC sequence contigs (blue bars) were aligned to At chromosomes based on significant and directional matches of sequences using a BLASTZ cutoff of <E-6.
Figure 2
Figure 2
Synteny between the B. rapa and A. thaliana genomes. (a) Percent coverage of individual chromosomes showing synteny between B. rapa and A. thaliana. Coverage was calculated as the gene number of an individual chromosome per sum of genes with BLASTP hits. Note that the overall coverage of an individual chromosome for the counterpart genome can exceed 100% because multiple best BLAST hits over the same region are counted. (b) Chromosome correspondence between B. rapa and A. thaliana represented by a dot-plot. Each dot represents a reciprocal best BLASTP match between gene pairs at an E-value cutoff of <E-20. Red dots show regions of synteny with more than 50% gene conservation as identified by DiagHunter. Some Br chromosome orientations have been flipped (A1f, A3f, A7f) to visually correspond to At orientations. Both Br and At have been scaled to occupy the same lengths. Color bars on the upper and left margins of the dot plot indicate individual chromosomes of At and Br, respectively. Black dots on the At chromosomes are centromeres. The color-shaded boxes in the dot plots represent long-range synteny blocks along chromosome pairs. Boxes with the same color are putative triplicated remnants. See Additional data file 3 and the URL cited in Materials and methods for all dot plots and related results, including detailed close-ups of regions of synteny.
Figure 3
Figure 3
Comparison of the genome structures of B. rapa and A. thaliana based on 24 ancestral karyotype genome building blocks. The genome structure of At was based on the reports of Schranz et al. [37] and Lysak et al. [38]. The position of genome blocks in the Br chromosome was defined by a comparison of Br-At syntenic relationships and the At-AK mapping results. Br sequences were connected to form continuous sequences. Block boundaries, orientation, and gaps between syntenic blocks are shown in Additional data file 4. Each color corresponds to a syntenic region between genomes. The Br genome is triplicated and more thoroughly rearranged than the At genome.
Figure 4
Figure 4
Traces of polyploidy events in plant genomes. (a-f) The distribution of Ks values obtained from comparisons of sets of putative orthologous genome sequences between Br and the selected model plant species Os (a), Pt (b), Mt (c), and At (d), and from paralogous sequences in At (e) and Br (f) genomes. The vertical axes indicate the frequency of paired sequences, while the horizontal axes denote Ks values with an interval of 0.1. The black bars depict the positions of the modes of Ks distributions obtained from orthologous or paralogous gene pairs. At, A. thaliana; Br, B. rapa; Mt, Medicago truncatula; Os, O. sativa; Pt, Populus trichocarpa.
Figure 5
Figure 5
Traces of polyploidy events in the Brassica 'A' and 'C' genomes. (a-g) Distributions of Ks values were obtained from comparisons of sets of paralogous EST sequences in Br (a), Bo (b), and Bna (c) and comparisons of putative orthologous EST sequences between the genomes (d-g). The vertical axes indicate the frequency of paired sequences, and the horizontal axes denote Ks values at 0.05 (a-f) or 0.02 (g) intervals. The black bars indicate the positions of the modes of Ks distributions obtained from comparisons of orthologous or paralogous gene pairs. Bna, B. napus; Bo, B. oleracea; Br, B. rapa.
Figure 6
Figure 6
Polyploidy events in the evolution of the Brassica genome. Each star indicates a WGD (1R, 2R, and 3R) or WDT (4R) event on the branch. Estimation of dates for polyploidy and speciation events are given in million years and are based on the Ks analysis performed in this study, except for the 1R event, which was inferred from a previous report [1]. A geographic time-table is provided on the right border of the figure. At, A. thaliana; Bna, B. napus; Bo, B. oleracea; Br, B. rapa; Mt, Medicago truncatula; Os, O. sativa; Pt, Populus trichocarpa.

Similar articles

  • Sequence and structure of Brassica rapa chromosome A3.
    Mun JH, Kwon SJ, Seol YJ, Kim JA, Jin M, Kim JS, Lim MH, Lee SI, Hong JK, Park TH, Lee SC, Kim BJ, Seo MS, Baek S, Lee MJ, Shin JY, Hahn JH, Hwang YJ, Lim KB, Park JY, Lee J, Yang TJ, Yu HJ, Choi IY, Choi BS, Choi SR, Ramchiary N, Lim YP, Fraser F, Drou N, Soumpourou E, Trick M, Bancroft I, Sharpe AG, Parkin IA, Batley J, Edwards D, Park BS. Mun JH, et al. Genome Biol. 2010;11(9):R94. doi: 10.1186/gb-2010-11-9-r94. Epub 2010 Sep 27. Genome Biol. 2010. PMID: 20875114 Free PMC article.
  • The genome of the mesopolyploid crop species Brassica rapa.
    Wang X, Wang H, Wang J, Sun R, Wu J, Liu S, Bai Y, Mun JH, Bancroft I, Cheng F, Huang S, Li X, Hua W, Wang J, Wang X, Freeling M, Pires JC, Paterson AH, Chalhoub B, Wang B, Hayward A, Sharpe AG, Park BS, Weisshaar B, Liu B, Li B, Liu B, Tong C, Song C, Duran C, Peng C, Geng C, Koh C, Lin C, Edwards D, Mu D, Shen D, Soumpourou E, Li F, Fraser F, Conant G, Lassalle G, King GJ, Bonnema G, Tang H, Wang H, Belcram H, Zhou H, Hirakawa H, Abe H, Guo H, Wang H, Jin H, Parkin IA, Batley J, Kim JS, Just J, Li J, Xu J, Deng J, Kim JA, Li J, Yu J, Meng J, Wang J, Min J, Poulain J, Wang J, Hatakeyama K, Wu K, Wang L, Fang L, Trick M, Links MG, Zhao M, Jin M, Ramchiary N, Drou N, Berkman PJ, Cai Q, Huang Q, Li R, Tabata S, Cheng S, Zhang S, Zhang S, Huang S, Sato S, Sun S, Kwon SJ, Choi SR, Lee TH, Fan W, Zhao X, Tan X, Xu X, Wang Y, Qiu Y, Yin Y, Li Y, Du Y, Liao Y, Lim Y, Narusaka Y, Wang Y, Wang Z, Li Z, Wang Z, Xiong Z, Zhang Z; Brassica rapa Genome Sequencing Project Consortium. Wang X, et al. Nat Genet. 2011 Aug 28;43(10):1035-9. doi: 10.1038/ng.919. Nat Genet. 2011. PMID: 21873998
  • Complexity of genome evolution by segmental rearrangement in Brassica rapa revealed by sequence-level analysis.
    Trick M, Kwon SJ, Choi SR, Fraser F, Soumpourou E, Drou N, Wang Z, Lee SY, Yang TJ, Mun JH, Paterson AH, Town CD, Pires JC, Pyo Lim Y, Park BS, Bancroft I. Trick M, et al. BMC Genomics. 2009 Nov 18;10:539. doi: 10.1186/1471-2164-10-539. BMC Genomics. 2009. PMID: 19922648 Free PMC article.
  • Deciphering the diploid ancestral genome of the Mesohexaploid Brassica rapa.
    Cheng F, Mandáková T, Wu J, Xie Q, Lysak MA, Wang X. Cheng F, et al. Plant Cell. 2013 May;25(5):1541-54. doi: 10.1105/tpc.113.110486. Epub 2013 May 7. Plant Cell. 2013. PMID: 23653472 Free PMC article.
  • Conserved microstructure of the Brassica B Genome of Brassica nigra in relation to homologous regions of Arabidopsis thaliana, B. rapa and B. oleracea.
    Navabi ZK, Huebert T, Sharpe AG, O'Neill CM, Bancroft I, Parkin IA. Navabi ZK, et al. BMC Genomics. 2013 Apr 15;14:250. doi: 10.1186/1471-2164-14-250. BMC Genomics. 2013. PMID: 23586706 Free PMC article.

Cited by

References

    1. De Bodt S, Maere S, Peer Y Van de. Genome duplication and the origin of angiosperm. Trends Ecol Evol. 2005;20:591–597. doi: 10.1016/j.tree.2005.07.008. - DOI - PubMed
    1. Sun G, Dilcher DL, Zheng Z, Zhou Z. In search of the first flower: a Jurassic angiosperm, Archaefructus, from northeast China. Science. 1998;282:1692–1695. doi: 10.1126/science.282.5394.1692. - DOI - PubMed
    1. Sun G, Ji Q, Dilcher DL, Zheng S, Nixon KC, Wang X. Archaefructaceae, a new basal angiosperm family. Science. 2002;296:899–904. doi: 10.1126/science.1069439. - DOI - PubMed
    1. Leitch IJ, Soltis DE, Soltis PS, Bennett MD. Evolution of DNA amounts across land plants (embryophyta). Ann Bot. 2005;95:207–217. doi: 10.1093/aob/mci014. - DOI - PMC - PubMed
    1. Blanc G, Wolfe KH. Widespread paleopolyploidy in model plant species inferred from age distributions of duplicate genes. Plant Cell. 2004;16:1667–1678. doi: 10.1105/tpc.021345. - DOI - PMC - PubMed

Publication types

LinkOut - more resources