. 2009 Dec 18;284(51):35412-24.
doi: 10.1074/jbc.M109.035394.

Evidence for the Existence in Arabidopsis thaliana of the Proteasome Proteolytic Pathway: ACTIVATION IN RESPONSE TO CADMIUM

Affiliations

Evidence for the Existence in Arabidopsis thaliana of the Proteasome Proteolytic Pathway: ACTIVATION IN RESPONSE TO CADMIUM

Cécile Polge et al. J Biol Chem. .

Abstract

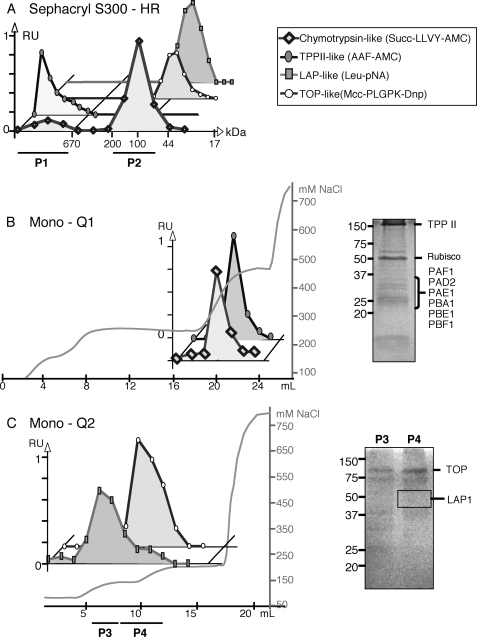
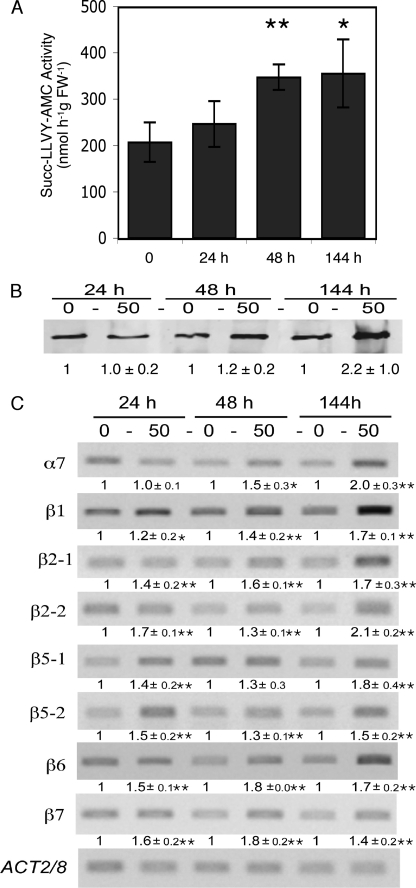
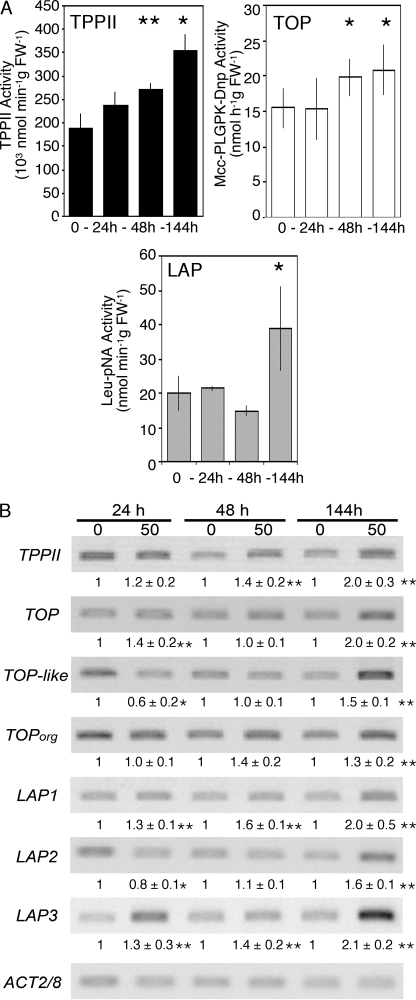
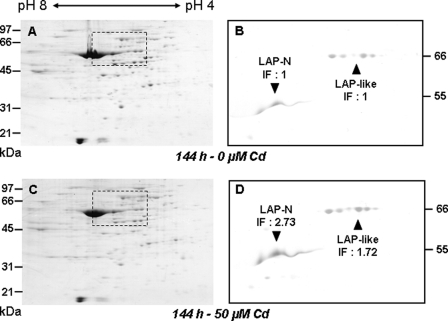
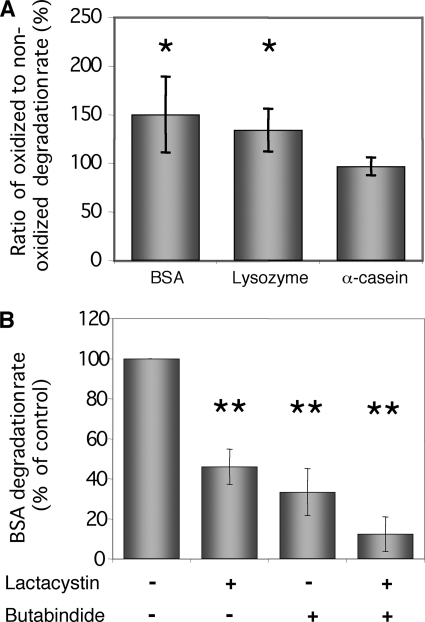
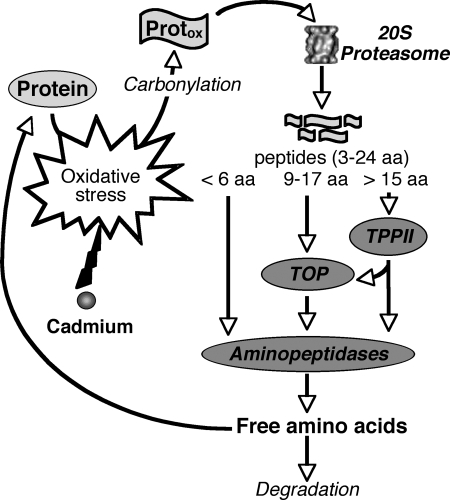
Heavy metals are known to generate reactive oxygen species that lead to the oxidation and fragmentation of proteins, which become toxic when accumulated in the cell. In this study, we investigated the role of the proteasome during cadmium stress in the leaves of Arabidopsis thaliana plants. Using biochemical and proteomics approaches, we present the first evidence of an active proteasome pathway in plants. We identified and characterized the peptidases acting sequentially downstream from the proteasome in animal cells as follows: tripeptidyl-peptidase II, thimet oligopeptidase, and leucine aminopeptidase. We investigated the proteasome proteolytic pathway response in the leaves of 6-week-old A. thaliana plants grown hydroponically for 24, 48, and 144 h in the presence or absence of 50 mum cadmium. The gene expression and proteolytic activity of the proteasome and the different proteases of the pathway were found to be up-regulated in response to cadmium. In an in vitro assay, oxidized bovine serum albumin and lysozyme were more readily degraded in the presence of 20 S proteasome and tripeptidyl-peptidase II than their nonoxidized form, suggesting that oxidized proteins are preferentially degraded by the Arabidopsis 20 S proteasome pathway. These results show that, in response to cadmium, the 20 S proteasome proteolytic pathway is up-regulated at both RNA and activity levels in Arabidopsis leaves and may play a role in degrading oxidized proteins generated by the stress.


Figures

FIGURE 1.
FIGURE 1.
Partial purification and characterization of the proteases involved in the proteasome pathway from A. thaliana leaves. A, enzymatic activity elution pattern during S-300 Sephacryl chromatography. P1 refers to the fractions containing 20 S proteasome and TPPII activities; P2 refers to the fractions containing TOP and LAP activities. B, anion-exchange chromatography (Mono Q) of the proteins present in P1 pool (from the Sephacryl S-300-HR) and SDS-polyacrylamide gel of the fraction containing the maximum activity of proteasome 20 S and TPPII used for protein identification by mass spectrometry analysis. Rubisco, ribulose-bisphosphate carboxylase/oxygenase. C, anion-exchange chromatography step (Mono Q) of the proteins present in the P2 pool (from the Sephacryl S-300-HR) and SDS-polyacrylamide gels of the pools P3 and P4 used for protein identification by mass spectrometry analysis. Activities are expressed as relative units ranging from null to one. Salt concentration of elution buffer is expressed as millimolar NaCl. RU, relative units.
FIGURE 2.
FIGURE 2.
Changes in 20 S proteasome activity, amount, and transcript levels in the leaves of Arabidopsis plants grown for 24, 48, and 144 h in the presence of 50 μm cadmium. 20 S proteasome chymotrypsin-like activity (A), amount (B), and subunit transcript levels measured by semi-quantitative RT-PCR (C). Western blot (B) and luminescent (C) signals were quantified using the Quantity One software (Bio-Rad). Values represent the relative intensity of each signal normalized to control (0 cadmium) in B and to ACT 2/8 signal in C. Data represent the mean of three (activity), six (Western blot) and three (transcript) biological replicates. Asterisks indicate significant differences between cadmium-treated and control plants (**, <0.01; *, < 0.05, Student's t test).
FIGURE 3.
FIGURE 3.
Changes in activity, amount, and transcript level of various proteases in the leaves of Arabidopsis plants grown for 24, 48, and 144 h in the presence of 50 μm cadmium. A, activity. TPPII and TOP + TOPL activities are expressed in nmol h−1 g FW−1; LAP activities are expressed in nmol min−1 g FW−1. Data represent the mean ± S.D. of three independent experiments. B, transcript levels measured by semi-quantitative RT-PCR. Luminescent signals were quantified using the Quantity One software (Bio-Rad). Values represent the relative intensity of each signal normalized to control (0 cadmium) and to ACT 2/8 signal. Data represent the means ± S.D. of three independent biological replicates. Asterisks indicate significant differences between cadmium-treated and control plants (**, <0.01, and *, < 0.05, Student's t test).
FIGURE 4.
FIGURE 4.
Accumulation of LAP-A and 66-kDa LAP-like proteins in the leaves of Arabidopsis plants grown for 144 h in the presence of 50 μm cadmium. Total proteins (80 μg) were fractionated by two-dimensional PAGE and visualized by Coomassie Blue R-250 staining for protein loading control (A and C) or electroblotted and incubated with a 1:5000 (w/v) dilution of polyclonal LAP-A antiserum (B and D). LAP-A (▼) and LAP-like (▲) proteins masses are shown (in kDa). The pH range of the isoelectric focusing gels and the protein size markers are mentioned. Immunoblots B and D correspond to the dashed rectangles in Coomassie-stained gels A and C, respectively. Western blot signals were quantified using the Quantity One software (Bio-Rad). The increase factor (IF) in protein amounts in cadmium-treated versus control plants is indicated below each protein name.
FIGURE 5.
FIGURE 5.
Degradation of oxidized protein by 20 S proteasome/TPPII. A, degradation rate of oxidized proteins are normalized to the degradation rate of nonoxidized proteins. The degradation rate of BSA, lysozyme, and α-casein was determined by fluorescent assays using fluorescamine as described under “Experimental Procedures.” Data represent the means ± S.D. of three independent biological replicates. B, effect of 20 S proteasome (10 μm lactacystin) and TPPII (20 μm butabindide) inhibitors on the degradation rate of BSA. Asterisks indicate significant differences between treated and control assays (**, <0.01, and *, <0.05, Student's t test).
FIGURE 6.
FIGURE 6.
Putative function of the 20 S proteasome proteolytic pathway during cadmium and, more generally, oxidative stress. Results presented in this study strongly suggest that the 20 S proteasome, TPPII, TOP, and aminopeptidases participate in the degradation of oxidized proteins generated during stress to protect cells against toxicity. Free amino acids released from this pathway are used for the synthesis of new proteins, although oxidatively modified amino acids are degraded.

References

    1. Sanita di Toppi L., Gabbrielli R. (1999) Environ. Exp. Bot. 41, 105–130
    1. Wagner G. (1993) Adv. Agron. 51, 173–212
    1. Liu J., Qian S. Y., Guo Q., Jiang J., Waalkes M. P., Mason R. P., Kadiiska M. B. (2008) Free Radic. Biol. Med. 45, 475–481 - PMC - PubMed
    1. Lafuente A., Cabaleiro T., Caride A., Romero A. (2008) Electron. J. Environ. Agric. Food Chem. 7, 3363–3371
    1. Davies K. J. (2001) Biochimie 83, 301–310 - PubMed

Publication types

MeSH terms