. 2009 Dec;21(12):1329-40.
doi: 10.1093/intimm/dxp100. Epub 2009 Oct 11.

Regulatory and pro-inflammatory phenotypes of myelin basic protein-autoreactive T cells in multiple sclerosis

Affiliations

Regulatory and pro-inflammatory phenotypes of myelin basic protein-autoreactive T cells in multiple sclerosis

Jian Hong et al. Int Immunol. 2009 Dec.

Abstract

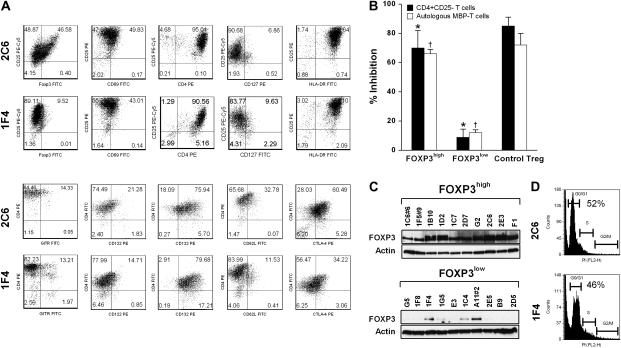
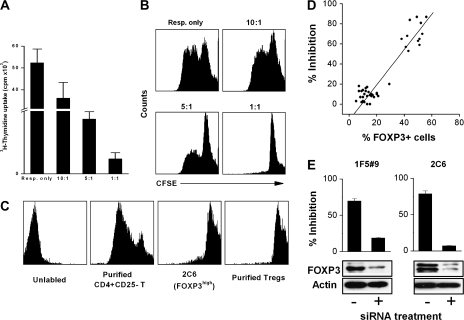
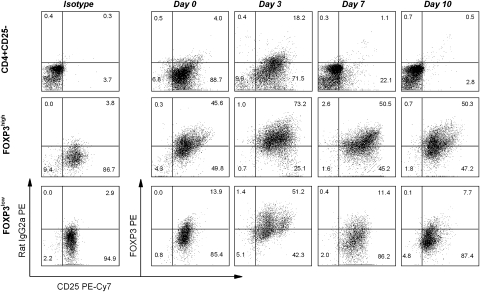
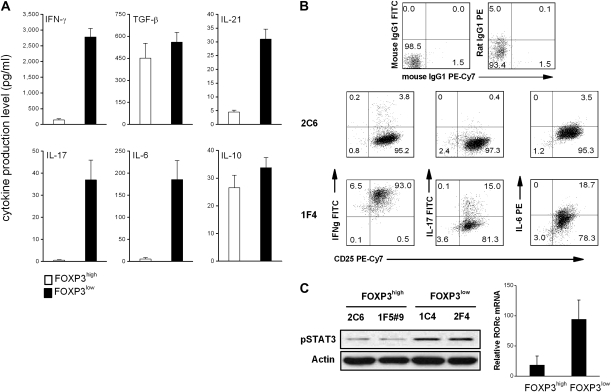
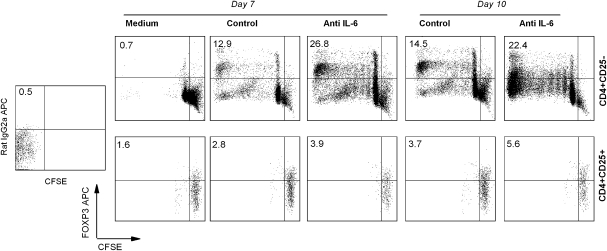
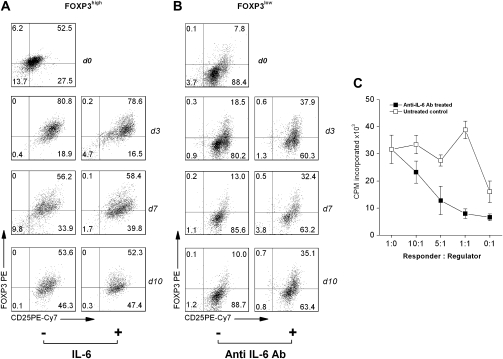
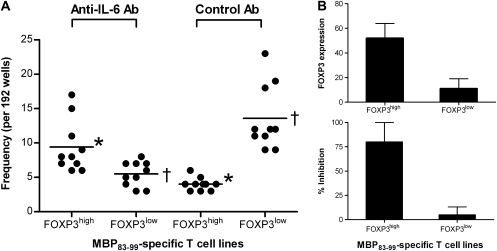
MBP-specific autoreactive T cells are considered pro-inflammatory T cells and thought to play an important role in the pathogenesis of multiple sclerosis (MS). Here, we report that MBP(83-99)-specific T cells generated from MS patients (n = 7) were comprised of pro-inflammatory and regulatory subsets of distinct phenotypes. The pro-inflammatory phenotype was characterized by high production of IFN-gamma, IL-6, IL-21 and IL-17 and low expression of FOXP3, whereas the regulatory subset expressed high levels of FOXP3 and exhibited potent regulatory functions. The regulatory subset of MBP-specific T cells appeared to expand from the CD4(+)CD25(-) T-cell pool. Their FOXP3 expression was stable, independent of the activation state and it correlated with suppressive function and inversely with the production of IFN-gamma, IL-6, IL-21 and IL-17. In contrast, the phenotype and function of FOXP3(low) MBP-specific T cells were adaptive and dependent on IL-6. The higher frequency of FOXP3(high) MBP-specific T cells was observed when IL-6 was neutralized in the culture of PBMC with MBP. The study provides new evidence that MBP-specific T cells are susceptible to pro-inflammatory cytokine milieu and act as either pro-inflammatory or regulatory T cells.


Figures

Fig. 1.
Fig. 1.
Characterization of MBP83–99-specific pro-inflammatory and Tregs. MBP83–99-specific T-cell clones were established from the peripheral blood of patients with MS. Before the experiments, cells were cultured for at least 5 days after the last stimulation with soluble anti-CD3 (2 μg ml−1) and anti-CD28 (1 μg ml−1) antibodies. (A) Two representative MBP83–99-specific T-cell clones (clone 2C6 and clone 1F4) were characterized by flow cytometric analysis for the indicated cell surface markers and FOXP3 expression. (B) Suppressive functions of FOXP3high MBP83–99-specific T-cell clones. Ten clones per group were selected from all FOXP3high and FOXP3low clones. They were analyzed for anti-proliferation properties using CD4+CD25 T cells and a selected autologous FOXP3low MBP-specific T-cell clone as responder cells. The ratio of responder to inhibitor was 1:1. Purified CD4+CD25+ natural Treg cells were used as a control. Data are presented as mean ± SD from all the clones tested. A Student's t-test was used to statistically analyze the difference between the comparable inhibition groups (asterisks indicate comparable groups in the inhibition of CD4+CD25 responder T cells; daggers indicate comparable groups in the inhibition of autologous MBP-reactive responder T cells). The P value of t-test is <0.05. The experiments for control Treg were performed independently three times. The error bar for control Treg indicates the SD of inter-experimental mean. (C) Western blot analysis of FOXP3 expression was performed for 20 selected T-cell clones representing FOXP3high and FOXP3low subsets of MBP83–99-specific T cells. (D) Cell cycle was analyzed using PI staining for clone 2C6 and clone 1F4 at the same the time point of culture as assayed in (A). The percent of cells in G0/G1 phase is indicated.
Fig. 2.
Fig. 2.
The inhibitory function of MBP83–99-specific T cells and their correlation with FOXP3. (A) CD4+CD25 T cells (responder cell or Resp.) were stimulated with anti-CD3 and anti-CD28 antibodies. FOXP3high T cells (regulator cell, clone 2C6) were added to the culture at different responder to regulator ratio. After 72 h, cells were pulsed with [3H]TdR and harvested for c.p.m. determination. (B) In another parallel experiment, responder cells were labeled with CFSE and the proliferation was measured by CFSE signal by flow cytometry. (C) The proliferative ability of FOXP3high cells was analyzed by CFSE dilution. CFSE-labeled cells were stimulated with anti-CD3 and anti-CD28 antibodies for 72 h. CFSE dilution was determined by flow cytometry. Purified CD4+CD25 T cell and CD4+CD25+ Treg were used as controls. (D) Correlation of FOXP3 expression with suppressive function was analyzed in a total of 42 MBP83–99-specific T-cell clones. Suppressive function was assessed by the inhibition of the proliferation of autologous CD4+CD25 T cells activated by anti-CD3 and anti-CD28 antibodies. Clones with an inhibition rate >50% were considered Tregs for this study. (E) Inhibitions of clones 1F5#9 and 2C6 after the treatment with siRNA specific for FOXP3 were examined by the proliferation of activated CD4+CD25 T cells. Effectiveness of FOXP3 repression was assessed by western blot for samples transfected with negative control siRNA (Ambion) or FOXP3 siRNA.
Fig. 3.
Fig. 3.
Independent relationship between FOXP3 expression and T-cell activation state in FOXP3high MBP83–99-specific T-cell clones. Clone 2C6 and clone 1F4 were stimulated with anti-CD3 and anti-CD28 antibodies in the presence of irradiated APC. Purified CD4+CD25 T cells were used as a control. Cells were maintained by medium change and supplementation of 50 U ml−1 IL-2 every other day. Cells were collected at each time point for analysis of the expression of FOXP3 and CD25 by flow cytometry. It should be noted that cultured MBP83–99-specific T-cell clones showed sustained expression of CD25.
Fig. 4.
Fig. 4.
Cytokine production and level of pSTAT3 and RORc in FOXP3high and FOXP3low MBP83–99-specific T cells. (A) Culture supernatants of MBP83–99-specific T-cell clones (FOXP3high clones n = 10, FOXP3low clones n = 12) were harvested 3 days after initial antigen stimulation and measured by ELISA for the production of cytokines. (B) Clones 2C6 and 1F4 were stimulated with 50 ng ml−1 of phorbol myristate acetate and 1 μg ml−1 of calcium ionophore for 5 h in the presence of GolgiStop and subsequently harvested for intracellular cytokine analysis by flow cytometry. (C) Cells were collected from the culture of clones 2C6, 1F4, 1C4 and 1F5#9. Phosphorylated STAT3 was examined by western blot and mRNA level of RORc was measured by real-time PCR.
Fig. 5.
Fig. 5.
Expansion of antigen-induced FOXP3high Tregs from naive CD4+CD25 T-cell pool. PBMCs were obtained from MS patients that had significant response to MBP83–99 peptide stimulation as evidenced by proliferation assay. Purified CD4+CD25 T cells or CD4+CD25+ Treg cells (Miltenyi) from PBMC were pre-treated with 5 μM CFSE and cultured with 10 μg ml−1 MBP83–99 peptide plus irradiated APC in the presence of anti-IL-6 neutralizing antibody or isotype-matched control antibody. At day 7 and 10 after initial stimulation, cells were harvested and stained with anti-FOXP3 antibody. Cell division was analyzed by flow cytometry. The upper left quadrant is used to determine the frequency of FOXP3 up-regulated cells in CD4+ T cells.
Fig. 6.
Fig. 6.
Increased expression of FOXP3 in FOXP3low MBP83–99-specific T cells by IL-6 antagonism. (A and B) FOXP3high MBP83–99-specific T-cell clone 2E3 or FOXP3low MBP83–99-specific T-cell clone 1F4 (5 × 104) was cultured with anti-CD3 and anti-CD28 stimulation (5 μg ml−1 of each antibody) in the presence or absence of IL-6 (10 ng ml−1) or IL-6 neutralizing antibody (5 μg ml−1), respectively. During the culture, medium containing fresh IL-6 or anti-IL-6 antibody was supplied at the indicated concentration every other day. The resulting cells were collected at days 0, 3, 7 and 10 of culture for intracellular staining of FOXP3 by flow cytometery. (C) For inhibition assay, purified naive CD4+CD25 T cells (1 × 104, responder) were cultured with anti-IL-6 antibody-treated FOXP3low MBP83-99-specific T cells (regulator) harvested at day 3 of treatment in the presence of 1 × 105 irradiated-autologous APC for 72 h at the indicated ratios of regulator to responder. In parallel, FOXP3low MBP83–99-specific T cells cultured without anti-IL-6 antibody were harvested at the same time to serve as control regulator. The proliferation of responder cells was measured by [3H]TdR uptake and expressed as c.p.m. Results are the representative of three independent experiments.
Fig. 7.
Fig. 7.
The role of IL-6 in the generation of MBP83–99-specific T cells in MS patients. (A) PBMCs isolated from MS patients (n = 10) were stimulated with MBP83–99 peptide in the presence and absence of 5 μg ml−1 anti-IL-6 antibody in 96-well plates for 7 days. Fresh antibody was supplied every other day with medium change. Cells were then tested for their specificity to MBP83–99 peptide in a proliferation assay. MBP-specific T-cell lines were selected and assayed for the expression of FOXP3 by FACS and the inhibitory function. Frequencies of MBP-specific T-cell lines expressing high or low levels of FOXP3 were calculated as number of wells of interest per total wells tested (n = 192). The statistical difference of frequencies between cell line groups was analyzed by the Student’s t-test. Asterisks (P = 0.004) and daggers (P = 0.001) indicate the comparable cell line groups with significant differences, respectively. (B) Average levels of FOXP3 in MBP83–99-specific T-cell lines (94 for FOXP3high, 55 for FOXP3low) generated in the presence of anti-IL-6 antibody from 10 MS patients were analyzed by flow cytometry. Inhibitory functions of these resultant MBP83–99-specific T-cell lines were examined by the proliferation assay using autologous CD4+CD25 T cells as responder as described in the Methods.

Similar articles

Cited by

References

    1. Ben-Nun A, Cohen IR. Experimental autoimmune encephalomyelitis (EAE) mediated by T cell lines: process of selection of lines and characterization of the cells. J. Immunol. 1982;129:303. - PubMed
    1. Ota K, Matsui M, Milford EL, Mackin GA, Weiner HL, Hafler DA. T-cell recognition of an immunodominant myelin basic protein epitope in multiple sclerosis. Nature. 1990;346:183. - PubMed
    1. Zamvil S, Nelson P, Trotter J, et al. T-cell clones specific for myelin basic protein induce chronic relapsing paralysis and demyelination. Nature. 1985;317:355. - PubMed
    1. Mokhtarian F, McFarlin DE, Raine CS. Adoptive transfer of myelin basic protein-sensitized T cells produces chronic relapsing demyelinating disease in mice. Nature. 1984;309:356. - PubMed
    1. Zhang J, Markovic-Plese S, Lacet B, Raus J, Weiner HL, Hafler DA. Increased frequency of interleukin 2-responsive T cells specific for myelin basic protein and proteolipid protein in peripheral blood and cerebrospinal fluid of patients with multiple sclerosis. J. Exp. Med. 1994;179:973. - PMC - PubMed

Publication types

MeSH terms