. 2009 Dec 1;587(Pt 23):5613-31.
doi: 10.1113/jphysiol.2009.177535. Epub 2009 Oct 12.

Photostimulation of channelrhodopsin-2 expressing ventrolateral medullary neurons increases sympathetic nerve activity and blood pressure in rats

Affiliations

Photostimulation of channelrhodopsin-2 expressing ventrolateral medullary neurons increases sympathetic nerve activity and blood pressure in rats

Stephen B G Abbott et al. J Physiol. .

Abstract

To explore the specific contribution of the C1 neurons to blood pressure (BP) control, we used an optogenetic approach to activate these cells in vivo. A lentivirus that expresses channelrhodopsin-2 (ChR2) under the control of the catecholaminergic neuron-preferring promoter PRSx8 was introduced into the rostral ventrolateral medulla (RVLM). After 2-3 weeks, ChR2 was largely confined to Phox2b-expressing neurons (89%). The ChR2-expressing neurons were non-GABAergic, non-glycinergic and predominantly catecholaminergic (54%). Photostimulation of ChR2-transfected RVLM neurons (473 nm, 20 Hz, 10 ms, 9 mW) increased BP (15 mmHg) and sympathetic nerve discharge (SND; 64%). Light pulses at 0.2-0.5 Hz evoked a large sympathetic nerve response (16 x baseline) followed by a silent period (1-2 s) during which another stimulus evoked a reduced response. Photostimulation activated most (75%) RVLM baroinhibited neurons sampled with 1/1 action potential entrainment to the light pulses and without accommodation during 20 Hz trains. RVLM neurons unaffected by either CO(2) or BP were light-insensitive. Bötzinger respiratory neurons were activated but their action potentials were not synchronized to the light pulses. Juxtacellular labelling of recorded neurons revealed that, of these three cell types, only the cardiovascular neurons expressed the transgene. In conclusion, ChR2 expression had no discernable effect on the putative vasomotor neurons at rest and was high enough to allow precise temporal control of their action potentials with light pulses. Photostimulation of RVLM neurons caused a sizable sympathoactivation and rise in blood pressure. These results provide the most direct evidence yet that the C1 neurons have a sympathoexcitatory function.


Figures

Figure 2
Figure 2. Selective expression of ChR2 by excitatory neurons including subsets of C1 and RTN cells
A, co-localization of the ChR2-mCherry fusion protein and VGLUT2 mRNA in the C1 region of the rostral ventrolateral medulla. mCherry was revealed by immunofluorescence (Aa, dsRed, reporter Cy3) and VGLUT2 mRNA by non-radioactive ISH (Ab, brightfield). Dual-labelled neurons are indicated by the arrows. B, co-localization of the ChR2-mCherry fusion protein (Ba, immunofluorescence) and pre-pro-NPY mRNA (Bb, ISH, brightfield). In the ventrolateral medulla ppNPY mRNA is a specific marker of a subset of C1 neurons. C, co-localization of the ChR2-mCherry fusion protein (Ca; immunofluorescence) and VGLUT2 mRNA (Cb; ISH, brightfield). These very superficial glutamatergic neurons are a subset of RTN neurons. D, co-localization of the ChR2-mCherry fusion protein (Da; immunofluorescence) and pre-pro-galanin mRNA (Db; ISH, brightfield). ppGal mRNA is a specific marker of a subset of RTN neurons. E, the ChR2-mCherry fusion protein (Ea; immunofluorescence) and GAD67 mRNA (Eb; ISH, brightfield) were not co-localized. Star indicates ChR2-expressing neuron in Ea and its location in the brightfield photograph (Eb) F, the neurons that expressed the ChR2-mCherry fusion protein (Fa; immunofluorescence) were always located below the glycinergic cells (Fb, GlyT2 mRNA ISH, brightfield). Scale bar shown in Fb represents 75 μm for panels Aa–Eb and 150 μm for panels Fa and Fb.
Figure 1
Figure 1. PRSx8-channel rhodopsin2 (ChR2)-mCherry-expressing neurons and their distribution in the ventral medulla
A, computer assisted plots of mCherry-expressing neurons in several coronal planes from a representative case. Circles represent non-tyrosine hydroxylase (TH) immunoreactive (ir) neurons that express the ChR2-mCherry fusion protein. Squares represent mCherry-expressing neurons that are also TH-ir. Numbers on the right hand side of each drawing are the mm caudal to bregma after the atlas of Paxinos & Watson (2005). Scale bar is 500 μm. Abbreviations: 7, facial motor nucleus; Amb, ambiguus nucleus; IO, inferior olivary nucleus; py, pyramidal tract, sp5, spinal trigeminal tract. B, average number of counted neurons per section from 12 rats. Counts were made from a 1 in 6 series of 30 μm coronal sections. Error bars represent s.e.m.C, digital images of neurons in the C1 area of the ventral lateral medulla from the case illustrated in panel A Bregma level 12.14. a, neurons expressing ChR2 mCherry revealed with immunofluorescence for DsRed. b, C1 neurons revealed with immunofluorescence for TH. c, merge of a and b. Note neurons expressing mCherry only (arrows) or TH only (asterisks). Most of the neurons in this image are double-labelled and appear white. Scale bar is 50 μm.
Figure 3
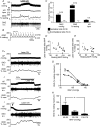
Figure 3. Photostimulation of ChR2-expressing RVLM neurons activates BP. HR and SND
A, representative examples of the cardiovascular effects produced by photostimulation of the RVLM with pulsed laser light (20 Hz, 10 ms, 9 mW). Traces from top to bottom represent arterial pressure (AP), heart rate (HR), integrated sympathetic nerve discharge (SND; rectified and integrated with 2 s time constant and expressed relative to resting discharge, 0% representing the value observed at saturation of the baroreflex and 100% the resting level), and raw SND. B, a waveform average of rectified SND triggered by laser pulse onset. This excerpt is from the animal shown in A. C, group data showing the effect of photostimulation (30 s trains, 20 Hz, 10 ms pulses, 9 mW) on the ipsilateral (n= 10) and contralateral (n= 4) side to ChR2 transfection. *P < 0.05, **P < 0.01, ***P < 0.001. D, relationship between the increase in BP caused by photostimulation and the resting level of BP (4 data points per rat; 10 rats). E, relationship between the increase in SND caused by photostimulation and the resting level of BP (4 data points per rat; 10 rats). Fa–c, representative examples of the SND effect produced by photostimulation (20 Hz, 10 ms, 9 mW) at normal (a), raised (b) or lowered (c) AP. Gradual aortic occlusion (AOc) was used to raise AP and sodium nitroprusside (SNP) was used to lower AP. G, a representative case demonstrating the effects of photostimulation on SND over a wide range of arterial pressure. SND is expressed relative to the maximum discharge observed when the baroreflex was unloaded with SNP as 100% and the value observed at saturation of the baroreflex representing 0%. H, grouped data from G (n = 5) grouped into tertiles according to arterial pressure. *P < 0.05, multiple comparisons.
Figure 4
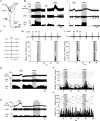
Figure 4. Photoactivation of RVLM cardiovascular neurons
A, experimental design. The fibre optic was inserted at a 20 deg angle from the vertical and single units were recorded using a vertically inserted glass pipette. Antidromic activation was tested by electrical stimulation of the spinal cord at the level of the third thoracic segment. Ba and b, representative examples of the activation of a single cardiovascular neuron by photostimulation of the RVLM with pulsed laser light (20 Hz, 10 ms, 9 mW). The complete inhibition of the cell activity by a relatively modest increase in BP (AOc, aortic occlusion) is a defining characteristic of this cell group. Note that the firing rate of both neurons rapidly settled to the frequency of the laser (20 Hz). C, collision test performed on one of the cardiovascular neurons demonstrating that this cardiovascular cell had an axonal projection to the spinal cord. The slow antidromic latency (55 ms) identified this cell as a C1 neuron. Da and b, upper trace: photoactivation of two cardiovascular neurons shown at high time resolution. The response shown in Da was the most typical. Each light pulse produced a single action potential at an invariant latency. Lower trace: raster plot and the event-triggered histogram (trigger at onset of light pulse; 1 ms bin) of a period of photostimulation (20 Hz, 10 ms). The cell shown in Db occasionally fired a second action potential at the end of the light pulse. This response was uncommon. Note that in both cases, photostimulation suppressed action potentials between light pulses. E, example of cardiovascular neuron that was inhibited during photostimulation of the RVLM. This inhibition may have been caused by the rise in BP. F, as in D, except for the inhibited cell shown in E. There is a slight activation of the cell during the laser pulse followed by reduced activity based on the resting activity (shown in grey). This pattern of activity was observed in 3 of 8 cells inhibited by photostimulation. G, example of a cell that was sensitive to neither increased AP nor photostimulation. H, a raster plot and event triggered histogram for the cell shown in G.
Figure 5
Figure 5. The effects of photostimulation on neurons in the RVLM
A, the effect of raising arterial pressure on the activity of recorded cells. Cells were grouped based on their sensitivity to laser light (LL) stimulation. Both LL activated (n= 26) and inhibited cells (n= 8) were virtually silenced by raising AP, but LL-insensitive cells (n= 17) were unaffected by elevated AP. *P < 0.05, **P < 0.01. B, the effect of photostimulation on the activity of recorded cells. *P < 0.05, **P < 0.01, ***P < 0.001 vs. resting frequency using paired t test. ##P < 0.01 as indicated using unpaired t test. C, grouped data from event-triggered histograms (1 ms bin) from LL activated neurons demonstrating that during 20 Hz laser stimulation, virtually all action potentials occur within 10 ms of the laser pulse onset with a large peak occurring 5 ms after the onset of the laser pulse. A subsidiary peak occurred between 9 and 10 ms representing cases when cells fired in couplets. For comparison, the same averaging of LL-insensitive cells shows no relationship with the timing of the laser pulse. D, the cumulative probability of the first evoked action potential in LL activated cells during photostimulation. This shows that virtually all laser-evoked action potentials occurred within 10 ms of the laser pulse onset. Cases in which laser pulses failed to evoke an action potential were ignored.
Figure 6
Figure 6. ChR2-expression by RVLM neurons with activity synchronized with light pulses
A, cardiovascular neuron with action potentials synchronized 1: 1 by the light pulses. This neuron was labelled juxtacellularly with biotinamide following its characterization as barosensitive and photoactivated. It is identified by the presence of green fluorescing Alexa 488 (panel Aa). Panel Ab shows that the same neuron (arrow) is immunoreactive for the ChR2-mCherry fusion protein (reporter: red fluorescing Cy3). B, respiratory neuron (post-inspiratory). This neuron was activated by light trains but its action potentials were not synchronized to the light pulses (a: biotinamide; b: ChR2-mCherry). This neuron contained no ChR2-mCherry and was located just dorsal to the cluster of neurons that expressed the transgene, i.e. in the Bötzinger region of the RVLM. Scale bar shown in Aa represents 25 μm in Aa and b and 100 μm in Ba and b. C, computer-assisted plots showing the location of the juxtacellularly labelled neurons. The mCherry-positive cardiovascular neurons are in black and the neurons that did not contain detectable levels of the transgene are in grey. Abbreviations: Amb, compact portion of the nucleus ambiguus. IO, inferior olive; pyr, pyramidal tract. Scale bar 0.5 mm.
Figure 7
Figure 7. The effects of low frequency photostimulation on SND
A, a representative recording demonstrating the effects of a single 20 ms pulse of laser light on rectified SND. Laser pulses evoked large, reproducible burst in SND, followed by a reduction in spontaneous SND between the laser-evoked bursts. The far right of the trace shows an expanded trace of the same stimulus. B, laser-evoked SND bursts are barosensitive. The upper trace represents a recording where phenylephrine (PE) was infused i.v. while 10 ms pulses were delivered at continuously 0.5 Hz. The SND burst is clearly abolished when AP is raised above 150 mmHg. Ba–c, laser pulse triggered waveform averages of SND bursts at three time points in B, demonstrating the attenuation of the burst by raised AP (b) and the recovery of the burst when AP returns to normal levels (c). C, a laser pulse triggered waveform average of a representative case. This case shows that after the initial burst, SND falls below baseline before slowly returning to pre-stimulus levels. Inset: two other cases where a small second peak was present. D, a representative example of the results from the paired-pulse paradigm, where a second pulse is delivered at a set latency after the initial pulse. This uncovered a post-stimulus inhibition of the paired pulse that recovered as the paired pulse latency increased. E, grouped data (n= 6) for D. *P < 0.05, **P < 0.01, ***P < 0.001 vs. control.

Similar articles

Cited by

References

    1. Abbott SBG, Stornetta RL, Fortuna MG, Depuy SD, West GH, Harris TE, Guyenet PG. Photostimulation of retrotrapezoid nucleus Phox2b-expressing neurons in vivo produces long-lasting activation of breathing in rats. J Neurosci. 2009;29:5806–5819. - PMC - PubMed
    1. Adamantidis AR, Zhang F, Aravanis AM, Deisseroth K, De Lecea L. Neural substrates of awakening probed with optogenetic control of hypocretin neurons. Nature. 2007;450:420–424. - PMC - PubMed
    1. Barman SM, Gebber GL. Axonal projection patterns of ventrolateral medullospinal sympathoexcitatory neurons. J Neurophysiol. 1985;53:1551–1566. - PubMed
    1. Boyden ES, Zhang F, Bamberg E, Nagel G, Deisseroth K. Millisecond-timescale, genetically targeted optical control of neural activity. Nat Neurosci. 2005;8:1263–1268. - PubMed
    1. Brown DL, Guyenet PG. Cardiovascular neurons of brain stem with projections to spinal cord. Am J Physiol Regul Integr Comp Physiol. 1984;247:R1009–R1016. - PubMed

Publication types

MeSH terms