. 2009 Dec;37(22):7498-508.
doi: 10.1093/nar/gkp823.

Molecular interactions between HNF4a, FOXA2 and GABP identified at regulatory DNA elements through ChIP-sequencing

Affiliations

Molecular interactions between HNF4a, FOXA2 and GABP identified at regulatory DNA elements through ChIP-sequencing

Ola Wallerman et al. Nucleic Acids Res. 2009 Dec.

Abstract

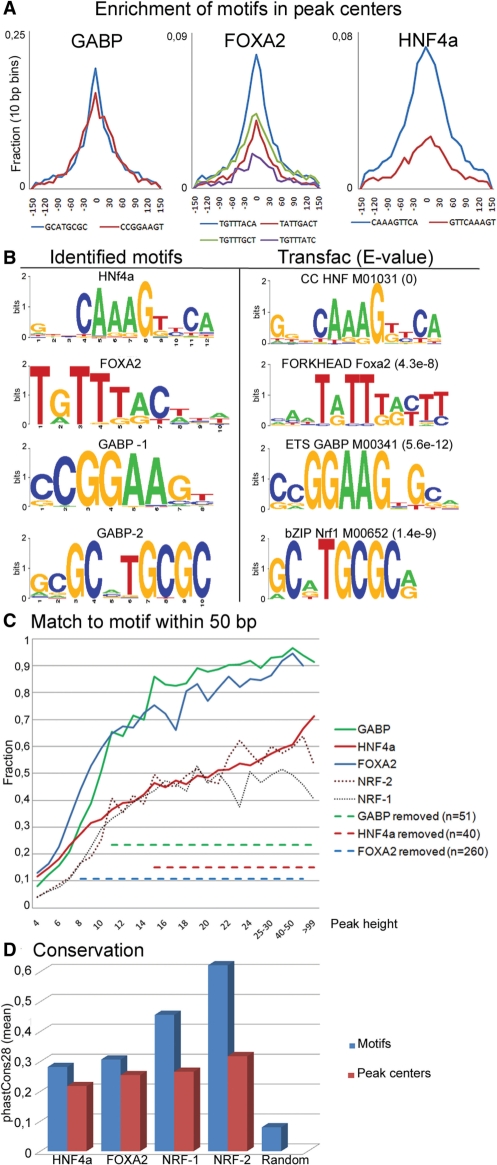
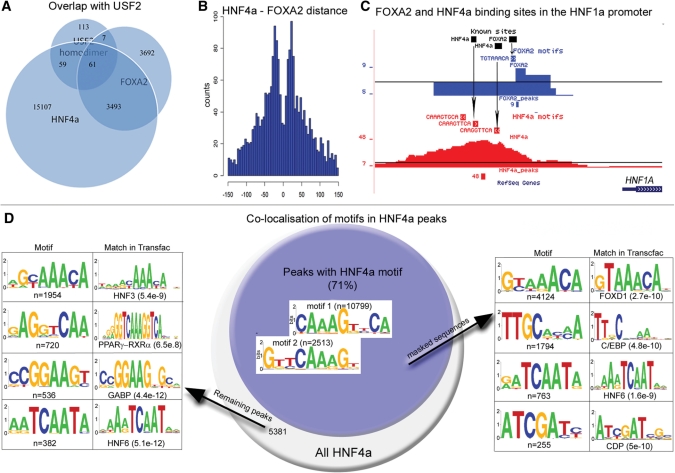
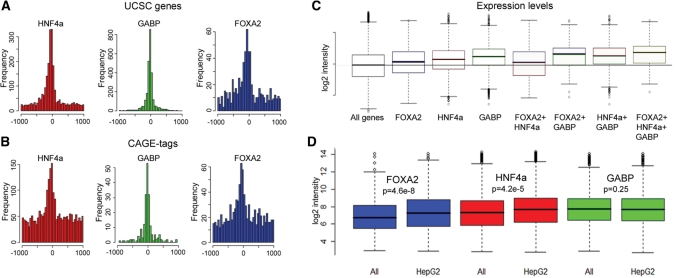
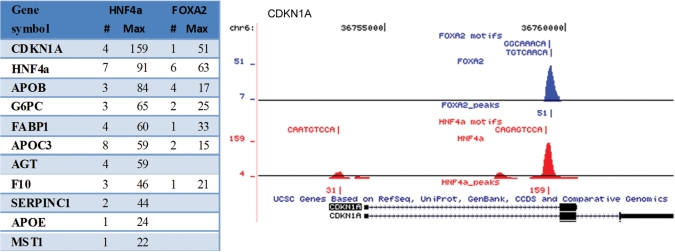
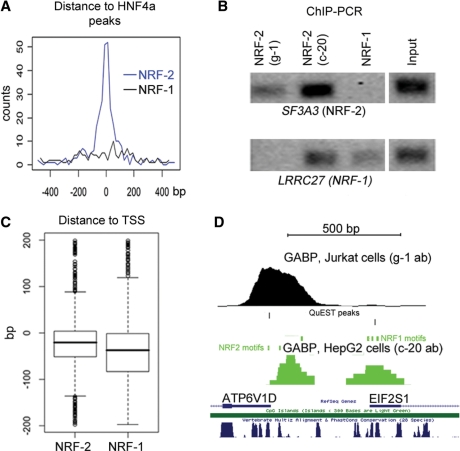
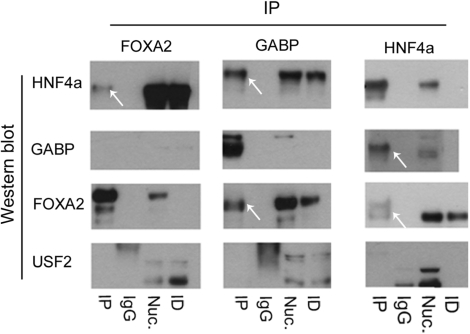
Gene expression is regulated by combinations of transcription factors, which can be mapped to regulatory elements on a genome-wide scale using ChIP experiments. In a previous ChIP-chip study of USF1 and USF2 we found evidence also of binding of GABP, FOXA2 and HNF4a within the enriched regions. Here, we have applied ChIP-seq for these transcription factors and identified 3064 peaks of enrichment for GABP, 7266 for FOXA2 and 18783 for HNF4a. Distal elements with USF2 signal was frequently bound also by HNF4a and FOXA2. GABP peaks were found at transcription start sites, whereas 94% of FOXA2 and 90% of HNF4a peaks were located at other positions. We developed a method to accurately define TFBS within peaks, and found the predicted sites to have an elevated conservation level compared to peak centers; however the majority of bindings were not evolutionary conserved. An interaction between HNF4a and GABP was seen at TSS, with one-third of the HNF4a positive promoters being bound also by GABP, and this interaction was verified by co-immunoprecipitations.


Figures

Figure 1.
Figure 1.
(A) Enrichment of the identified motifs in a 300 bp interval over peak centers, with the core sequences for each motif shown below the plot. (B) Sequence logos for the identified motifs and for the most similar motif from the Transfac database. (C) Fraction of peaks with at least one motif sequence within 50 bp of the center at different peak heights. Dotted lines indicate average motif content in removed peaks, starting at the significance threshold for each factor. (D) All identified motifs are significantly enriched for conserved bases compared to the centers of the same peaks.
Figure 2.
Figure 2.
Motifs in HNF4a and FOXA2 peaks. (A) Overlaps between HNF4a, FOXA2 and USF2 homodimers. (B) Distance between HNF4a and FOXA2 motifs in overlapping peaks. (C) The close location of FOXA2 and HNF4a sites are exemplified with identified motifs in the HNF1a promoter, with arrows indicating the positions of three sites taken from the literature. (D) Identification of co-localized motifs in HNF4a peaks. Peaks with a match within 100 bp to any of the two 9-bp motifs (blue circle, numbers indicate the number of peaks with the motifs) were reanalyzed after motif masking and found to contain HNF6, C/EBP, CDP and forkhead motifs (right panel). Reanalysis of the 5381 peaks with no match to the HNF4a using less stringent settings revealed motifs for HNF3, HNF6 and GABP (left panel).
Figure 3.
Figure 3.
Distribtion of peaks around TSSs and expression levels of bound genes. (A) All factors are enriched upstream of known TSS (UCSC genes) and a similar pattern (B) is seen around CAGE-tags for peaks that were not at a UCSC gene. (C) Genes bound by FOXA2, HNF4a and GABP have a higher expression than the average gene in HepG2, and genes where all factors are bound have the highest expression levels (P << 0.01 for all combinations). Horizontal line shows the median of all genes on the array. (D) Expression levels differ in HepG2 compared to non-liver derived cell lines for genes bound by HNF4a and FOXA2 but not for GABP.
Figure 4.
Figure 4.
HNF4a and FOXA2 peaks in genes down-regulated by RNAi against HNF4a. The table shows the number of peaks and maximum overlaps within 10 kb of target genes. In most cases several binding sites with high enrichment were seen. The profile over the CDKNA1 locus illustrates that in many cases the binding sites are intragenic.
Figure 5.
Figure 5.
Analysis of NRF-1 and NRF-2 motifs in GABP peaks. (A) Distribution of peaks with NRF-2 (blue) and NRF-1 (black) motifs around HNF4a peaks. (B) ChIP-PCR for sites containing either NRF-2 or NRF-1 motifs using two different GABP antibodies and one NRF-1 specific antibody. (C) NRF-2 motifs are located closer to TSS than NRF-1. (D) GABP signal is found both in Jurkat and HepG2 in the ATP6V1D promoter (left) but with different peak centers. Signals are also found in both datasets at a known NRF-1 site in the EIF2S1 promoter (right).
Figure 6.
Figure 6.
Co-immunoprecipitation results. Western blots are shown for HNF4a, NRF-2, USF2 and FOXA2 on IPs for the TFs and for IgG. Nuclear extract (Nuc) and Immuno depleted (ID) material are included as controls. White arrows indicate positive signals.

References

    1. Birney E, Stamatoyannopoulos JA, Dutta A, Guigo R, Gingeras TR, Margulies EH, Weng Z, Snyder M, Dermitzakis ET, Thurman RE, et al. Identification and analysis of functional elements in 1% of the human genome by the ENCODE pilot project. Nature. 2007;447:799–816. - PMC - PubMed
    1. Boyle AP, Davis S, Shulha HP, Meltzer P, Margulies EH, Weng Z, Furey TS, Crawford GE. High-resolution mapping and characterization of open chromatin across the genome. Cell. 2008;132:311–322. - PMC - PubMed
    1. Xi H, Shulha HP, Lin JM, Vales TR, Fu Y, Bodine DM, McKay RD, Chenoweth JG, Tesar PJ, Furey TS, et al. Identification and characterization of cell type-specific and ubiquitous chromatin regulatory structures in the human genome. PLoS Genetics. 2007;3:e136. - PMC - PubMed
    1. Barski A, Cuddapah S, Cui K, Roh TY, Schones DE, Wang Z, Wei G, Chepelev I, Zhao K. High-resolution profiling of histone methylations in the human genome. Cell. 2007;129:823–837. - PubMed
    1. Johnson DS, Mortazavi A, Myers RM, Wold B. Genome-wide mapping of in vivo protein-DNA interactions. Science. 2007;316:1497–1502. - PubMed

Publication types

MeSH terms

Substances