. 2009 Oct 19;187(2):295-310.
doi: 10.1083/jcb.200903098. Epub 2009 Oct 12.

Postsynaptic regulation of synaptic plasticity by synaptotagmin 4 requires both C2 domains

Affiliations

Postsynaptic regulation of synaptic plasticity by synaptotagmin 4 requires both C2 domains

Cynthia F Barber et al. J Cell Biol. .

Abstract

Ca(2+) influx into synaptic compartments during activity is a key mediator of neuronal plasticity. Although the role of presynaptic Ca(2+) in triggering vesicle fusion though the Ca(2+) sensor synaptotagmin 1 (Syt 1) is established, molecular mechanisms that underlie responses to postsynaptic Ca(2+) influx remain unclear. In this study, we demonstrate that fusion-competent Syt 4 vesicles localize postsynaptically at both neuromuscular junctions (NMJs) and central nervous system synapses in Drosophila melanogaster. Syt 4 messenger RNA and protein expression are strongly regulated by neuronal activity, whereas altered levels of postsynaptic Syt 4 modify synaptic growth and presynaptic release properties. Syt 4 is required for known forms of activity-dependent structural plasticity at NMJs. Synaptic proliferation and retrograde signaling mediated by Syt 4 requires functional C2A and C2B Ca(2+)-binding sites, as well as serine 284, an evolutionarily conserved substitution for a key Ca(2+)-binding aspartic acid found in other synaptotagmins. These data suggest that Syt 4 regulates activity-dependent release of postsynaptic retrograde signals that promote synaptic plasticity, similar to the role of Syt 1 as a Ca(2+) sensor for presynaptic vesicle fusion.


Figures

Figure 1.
Figure 1.
Evolution of the synaptotagmin family. (A) Diagram of the emergence of C2 domain proteins in eukaryotes. The number of synaptotagmin family members in each organism is shown in parentheses. The emergence of the E-Syt and multiple C2 domain and transmembrane region proteins (MCTP) families is noted. (B) Sequence alignment of the C2A and C2B domains of Syt 1 and Syt 4 is shown. Critical aspartic acid residues involved in Ca2+ coordination are shown in blue, with similar amino acids shown in green. The substitution of D3 to S in C2A of Syt 4 is highlighted in red.
Figure 2.
Figure 2.
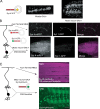
Syt 4 localization to postsynaptic compartments. (A) Diagram of N-terminal YFP-tagged Syt 4 (left). Expression in muscle with the Mhc-GAL4 driver (middle) and motor neurons with D42-GAL4 (right) is shown. Bars: (middle) 5 µm; (right) 20 µm. (B) Model of Syt 1–GFP and Syt 4–mRFP transgenic proteins expressed in motor neurons (left). Syt 1–GFP shows characteristic synaptic vesicle localization to presynaptic boutons at NMJs, whereas Syt 4–mRFP localizes to postsynaptic dendrites within the CNS. Merged image is displayed in the right panels. Bars: (top) 20 µm; (bottom) 50 µm. (C) Model of Syt 4–pHlourin transgenic protein expressed in motor neurons. No Syt 4 vesicle fusion is detected in presynaptic boutons at NMJs (top; counterstained with rhodamine-phallodin to highlight muscle 6/7). In contrast, Syt 4–pHlourin is readily detected in cell bodies and dendritic membranes in the CNS. Bars: (top) 50 µm; (bottom) 20 µm.
Figure 3.
Figure 3.
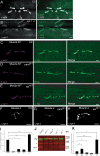
Activity-dependent regulation of Syt 4 expression. (A and B) Immunostaining with α–Syt 4 (left) and α-HRP (right) of wandering third instar control (A) or syt 1−/− (B) larvae at muscle fiber 6/7. Bars, 20 µm. (C–E) Immunostaining of control, parats1, and seits1 with α–Syt 4 and α-Dlg at muscle fiber 6/7 in third instar larvae reared at 25°C. Identical confocal settings were used for all images. (F–H) Immunostaining of control (CS), parats1, and seits1 with α–Syt 4 at muscle fiber 4 in third instar larvae reared at 25°C. Identical confocal settings were used for all images. (I) Quantification of Syt 4 protein levels in head extracts of control, syt 4BA1 nulls, parats1, syx3-69, and seits1 at 25°C (ANOVA, P < 0.00001). The data were analyzed by single-factor ANOVA, and significant differences between the groups were found (P < 0.00001). Student's t tests were used as a secondary test. Quantification was normalized to control by Student's t test: parats1, 0.21 ± 0.004 (n = 4; P < 0.01); syx3-69, 0.17 ± 0.003 (n = 8; P < 0.0005); seits1, 1.46 ± 0.08 (n = 7; P < 0.0005). (J) Western blot analysis of head extracts of the indicated genotypes probed with α–Syt 4 and α-Dlg (loading control, green). The cross-reacting epitope at 72 kD in the Syt 4 channel (present in syt 4null mutants and marked with an asterisk) serves as an additional internal loading control. (K) Quantification of Syt 4 mRNA expression by RT-PCR in the indicated genotypes reared at 25°C with or without a 20-min heat shock (HS) at 38°C (ANOVA, P < 0.002). GAPDH1 mRNA was used as control. The data were analyzed by single-factor ANOVA (P < 0.002) with Student's t tests used for secondary analysis. Quantification was normalized to control at 25°C by Student's t tests: control heat shock, 0.48 ± 0.10 (n = 5; P < 0.005); seits1 25°C, 2.0 ± 0.55 (n = 3; P < 0.05); seits1 heat shock, 5.8 ± 1.9 (n = 6; P < 0.025); parats1 heat shock, 0.28 ± 0.06 (n = 5; P < 0.005). *, P < 0.05; **, P < 0.01; ***, P < 0.001. Error bars indicate SEM. Bars, 20 µm.
Figure 4.
Figure 4.
Structure–function analysis of Syt 4 C2 domains. (A) Model depicting key residues involved in coordination of Ca2+ binding in the Syt 4 C2A domain. S284D indicates the location of the key Ca2+-binding residue that is an aspartic acid in other Syt family members. (B) Quantification of Syt 4–stimulated synaptic growth at muscle 6/7 of segment A3 (ANOVA, P < 0.0006). Third instar wandering larvae of the indicated genotypes reared at 25°C were immunostained with α-Cpx antisera. The data were analyzed by single-factor ANOVA (P < 0.0006), with Student's t test used as a secondary test. Quantified data normalized to Mhc-GAL4: Mhc-GAL4, 1 ± 0.09 (n = 11); Mhc-GAL4/UAS–syt 4, 1.6 ± 0.1 (n = 9); Mhc-GAL4/+; UAS–syt 4 D292N, 1.23 ± 0.07 (n = 10); Mhc-GAL4/UAS–syt 4 D427N D429N, 1.17 ± 0.07 (n = 13); Mhc-GAL4/UAS–syt 4 D292N D427N D429N, 1.1 ± 0.1 (n = 9); Mhc-GAL4/+; UAS–syt 4 S284A, 1.0 ± 0.08 (n = 11); Mhc-GAL4/+ UAS–syt 4 S284D, 1.5 ± 0.1 (n = 11). Significant differences were detected in bouton number by Student's t tests: D292N and Mhc-GAL4 control, P < 0.05; D292N and wild-type Syt 4, P < 0.0025; S284D and Mhc-GAL4 control, P < 0.0025; wild-type Syt 4 and Mhc-GAL4 control, P < 0.0025. (C) Representative immunocytochemical staining of third instar larval muscle 6/7 NMJs of the indicated genotypes with α-Cpx. *, P < 0.05; **, P < 0.01. Error bars indicate SEM. Bars, 20 µm.
Figure 5.
Figure 5.
Syt 4 regulates synaptic growth at the NMJ. (A) Quantification of synaptic bouton number at muscle 6/7 in segment A3 of wandering third instar larvae by α-Cpx immunocytochemistry. Homozygous syt 4–null mutants in trans to a deficiency show a significant reduction in bouton number compared with controls, which is rescued by expression of wild-type Syt 4 postsynaptically (ANOVA, P < 0.001). The data were analyzed by single-factor ANOVA (P < 0.001). Data normalized to precise excision: control, 1 ± 0.04 (n = 38); syt 4−/−, 0.76 ± 0.03 (n = 34). Data normalized to Df/precise excision: control, 1 ± 0.06, (n = 13); Df/syt 4, 0.72 ± 0.04 (n = 7). Data normalized to Mhc-GAL4, Df/precise excision: control, 1 ± 0.05 (n = 16); Mhc-GAL4, Df/syt 4, UAS–syt 4, 1.3 ± 0.06 (n = 15). Student's t test revealed significant differences between control and syt 4−/− (P < 0.001), control and Df/syt 4 (P < 0.01), Df/syt 4, and Mhc-GAL4, Df/syt 4; UAS–syt 4 (P = 0.0008), and syt 4−/− and Mhc-GAL4, Df/syt 4; UAS–syt 4 (P = 0.0007). (B) Quantification of synaptic bouton number in rescued animals (ANOVA, P < 0.017). The data were analyzed by single-factor ANOVA (P < 0.017). Mhc-GAL4, Df/syt 4: 1 ± 0.05 (n = 16); Mhc-GAL4, Df/syt 4; UAS–syt 4: 1.3 ± 0.06 (n = 15); Mhc-GAL4, Df/syt 4; UAS–syt 4 S284A: 1.1 ± 0.07 (n = 18); Mhc-GAL4, Df/syt 4; UAS–syt 4 D427N D429N: 1.2 ± 0.09 (n = 16). Student's t tests revealed significant differences between control and UAS–syt 4 rescue (P = 0.0003), UAS–syt 4 and UAS–syt 4 S284A rescue (P < 0.03), and control and UAS–syt 4 D427N D429N rescue (P = 0.02). (C) Quantification of active zone to bouton number at muscle 6/7 of segment A3 in wandering third instar larvae by α-Brp and α-Cpx immunocytochemistry. No significant difference was seen in mean active zone number per bouton in the null or overexpression lines. Data normalized to precise excision: precise excision, 1 ± 0.09 (n = 6 NMJs); syt 4−/−, 1.0 ± 0.11 (n = 5 NMJs). Overexpression lines normalized to Mhc-GAL4: Mhc-GAL4, 1 ± 0.11 (n = 7 NMJs); Mhc GAL4/UAS–syt 4, 0.94 ± 0.07 (n = 10 NMJs). (D–G) Representative staining of third instar NMJs of the indicated genotypes with α-Cpx (left) and α-Brp (right). *, P < 0.05; **, P < 0.01; ***, P < 0.001. Error bars indicate SEM. Bars, 20 µm.
Figure 6.
Figure 6.
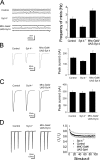
Syt 4 regulates neurotransmitter release. (A) Representative traces of spontaneous postsynaptic currents (minis) in control, syt 4–null mutants, and Syt 4 overexpression lines in 0.5 mM external Ca2+. Mean mini frequency in the strains: control, 2.47 ± 0.25 Hz; syt 4−/−, 1.42 ± 0.15 Hz; Mhc-GAL4/UAS–syt 4, 3.54 ± 0.27 Hz. The data are the mean of at least four different animals. Student's t tests revealed significant differences between control and syt 4−/− (P < 0.01) and between control and Mhc-GAL4/UAS–syt 4 (P < 0.01). (B) Evoked Excitatory postsynaptic currents (EPSCs) recorded in 0.5 mM external Ca2+ in control, syt 4–null mutants, and Syt 4 overexpression lines. Mean peak amplitude in the strains: control, 153 ± 6 nA; syt 4−/−, 123 ± 7 nA; Mhc-GAL4/UAS–syt 4, 196 ± 20 nA. Student's t tests revealed significant differences between control and syt 4−/− (P < 0.01) and between control and Mhc-GAL4/UAS–syt 4 (P < 0.01). (C) Evoked EPSCs recorded in 2 mM external Ca2+ in control, syt 4 mutants, and Syt 4 overexpression lines. Mean peak amplitude in the strains: control, 292 ± 19 nA; syt 4−/−, 280 ± 24 nA; Mhc-GAL4/UAS–syt 4, 300 ± 28 nA. Student's t tests revealed no significant differences between control and syt 4−/− or Mhc-GAL4/UAS–syt 4. (D) Evoked EPSCs recorded in 2 mM external Ca2+ during tetanic stimulation of the nerve at 10 Hz. The initial stimuli are shown on the left, and the mean evoked amplitude during 10 s of stimulation is displayed on the right. The depression parameter is expressed as 1 − EPSCss/EPSC1. The extent of depression estimated from steady state at the end of the stimulation episode was as follows: control, 0.38 ± 0.03; syt 4−/−, 0.30 ± 0.02; Mhc-GAL4/UAS–syt 4, 0.44 ± 0.04; and was significantly different between control and syt 4−/− (P < 0.01) and between control and Mhc-GAL4/UAS–syt 4 (P < 0.01). Error bars indicate SEM.
Figure 7.
Figure 7.
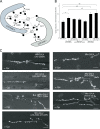
Posttetanic enhancement of spontaneous miniature release is regulated by Syt 4. (A) Current recordings of spontaneous miniature activity 2 min before and 9 min after the conditioning nerve stimulation (arrows) in syt 4–null mutants, control, and Mhc-GAL4/UAS–syt 4 overexpression lines in 0.5 mM Ca2+. (B) Grayscale representation of spontaneous miniature frequency before and after conditioning nerve stimulation (arrow) in four representative experiments. Each bit represents the frequency measured in 1 s. (C) Mean spontaneous miniature release normalized to the unconditioned spontaneous miniature frequency (fu). (D) Mean extent of spontaneous miniature frequency increase after 2 min of conditioned stimulus. The data are presented as the mean of at least five different larvae and expressed as the fraction of increase ([fcfu]/fu), where fu and fc are the unconditioned and conditioned spontaneous miniature frequency, respectively. The extent of increased spontaneous release for each genotype: control, 0.8 ± 0.07 (n = 5); syt 4−/−, 0.22 ± 0.02 (n = 5); Mhc-GAL4/UAS–syt 4 1.4 ± 0.1 (n = 5). Student's t tests revealed significant differences between control and syt 4−/− (P < 0.01) and between control and Mhc-GAL4/UAS–syt 4 (P < 0.01). (E) Representative traces (left) before and after tetanic stimulation to induce posttetanic mini frequency increases in the indicated genotypes. The extent of increase in mini frequency (right) was estimated as in D. Mean enhancements are Mhc-GAL4, Df/syt 4: 0.33 ± 0.03; Mhc-GAL4, Df/syt 4; UAS–syt 4 (D427 and 429N)/+: 0.35 ± 0.04; Mhc-GAL4, Df/syt 4; UAS–syt 4 (S284A)/+: 0.4 ± 0.04; Mhc-GAL4, Df/syt 4; UAS–syt 4 (S284D)/+: 0.81 ± 0.07; Mhc-GAL4, Df/syt 4; UAS–syt 4/+: 0.75 ± 0.08. Student's t tests revealed significant differences between Mhc-GAL4, Df/syt 4, and Df/syt 4; UAS–syt 4 (S284D)/+ (P < 0.01) and between Mhc-GAL4; Df/syt 4 and Mhc-GAL4; Df/syt 4; UAS–syt 4 (P < 0.01). No significant differences were found between the syt 4–null mutant and the UAS–syt 4 D427, 429N, and UAS–syt 4 S284A rescue lines. Arrows indicate onset of stimulation. (F) Quantification of posttetanic mini frequency increase in the indicated genotypes. Error bars indicate SEM.
Figure 8.
Figure 8.
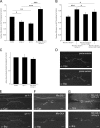
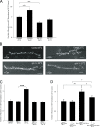
Syt 4 regulates activity-dependent synaptic growth at the NMJ. (A) Quantification of bouton number at muscle 6/7 of segment A3 in third instar wandering larvae of the indicated genotypes reared at 25 or 31°C (ANOVA, P < 0.00001). Quantification normalized to 25°C precise excision control larvae: control 25°C, 1 ± 0.06 (n = 14); control 31°C, 1.33 ± 0.06 (n = 12); syt 4−/− 25°C, 0.72 ± 0.04 (n = 11); syt 4−/− 31°C, 0.87 ± 0.07 (n = 13). The data were analyzed by single-factor ANOVA (P < 0.00001) with Student's t tests used for secondary analysis: control at 25 and 31°C, P < 0.001; control and syt 4−/− at 25°C, P < 0.001. (B) Representative immunocytochemical staining of third instar larval muscle 6/7 NMJs with α-Cpx of the indicated genotypes reared at 25 or 31°C. Bars, 20 µm. (C) Quantification of bouton number at muscle 6/7 of segment A3 in third instar wandering larvae of the indicated genotypes reared at 25 or 31°C (ANOVA, P < 0.00001). Data normalized to 25°C control: seits1 25°C, 0.96 ± 0.06 (n = 14); seits1 31°C, 1.6 ± 0.09 (P < 0.0005); seits1; syt 4−/− 25°C, 0.95 ± 0.07, (n = 15); seits1; syt 4−/− 31°C, 0.95 ± 0.07 (n = 10). The data were analyzed by single-factor ANOVA (P < 0.00001) with Student's t tests used for secondary analysis. (D) Quantification of bouton number at muscle 6/7 of segment A3 in third instar wandering larvae of the indicated genotypes reared at 25 or 31°C (ANOVA, P < 0.0002). Overexpression of Syt 4 in a parats1 background caused bouton overgrowth at the permissive temperature (normalized to parats1; Mhc-GAL4: parats1; Mhc-GAL4 25°C, 1 ± 0.1 [n = 10]; parats1; Mhc-GAL4/UAS–syt 4 25°C, 1.5 ± 0.1 [n = 11]; P < 0.003 by Student's t test). At the nonpermissive temperature, the enhanced growth is eliminated in controls (parats1; Mhc-GAL4 31°C, 0.98 ± 0.07 [n = 15]) and impaired in Syt 4 overexpression larvae (parats1; Mhc-GAL4/UAS–syt 4 31°C, 1.21 ± 0.07 [n = 11]; P < 0.05 by Student's t test). The data were analyzed by single-factor ANOVA (P < 0.0002) with Student's t tests used for secondary analysis. *, P < 0.05; **, P < 0.01; ***, P < 0.001. Error bars indicate SEM.

References

    1. Acharya U., Edwards M.B., Jorquera R.A., Silva H., Nagashima K., Labarca P., Acharya J.K.. 2006. Drosophila melanogaster Scramblases modulate synaptic transmission.J. Cell Biol. 173:69–82. doi:10.1083/jcb.200506159 - DOI - PMC - PubMed
    1. Adolfsen B., Littleton J.T.. 2001. Genetic and molecular analysis of the synaptotagmin family.Cell. Mol. Life Sci. 58:393–402. doi:10.1007/PL00000865 - DOI - PMC - PubMed
    1. Adolfsen B., Saraswati S., Yoshihara M., Littleton J.T.. 2004. Synaptotagmins are trafficked to distinct subcellular domains including the postsynaptic compartment.J. Cell Biol. 166:249–260. doi:10.1083/jcb.200312054 - DOI - PMC - PubMed
    1. Ataman B., Ashley J., Gorczyca M., Ramachandran P., Fouquet W., Sigrist S.J., Budnik V.. 2008. Rapid activity-dependent modifications in synaptic structure and function require bidirectional Wnt signaling.Neuron. 57:705–718. doi:10.1016/j.neuron.2008.01.026 - DOI - PMC - PubMed
    1. Barber C.F., Littleton J.T.. 2007. Synaptic growth and transcriptional regulation in Drosophila. In Transcriptional Regulation by Neuronal Activity: To the Nucleus and Back. Dudek S., editor. Springer Science Publishing, New York. 253–275.

Publication types

MeSH terms