. 2009 Dec;54(6):1360-8.
doi: 10.1161/HYPERTENSIONAHA.109.139428. Epub 2009 Oct 12.

Glutathione S-transferase-micro1 regulates vascular smooth muscle cell proliferation, migration, and oxidative stress

Affiliations

Glutathione S-transferase-micro1 regulates vascular smooth muscle cell proliferation, migration, and oxidative stress

Yanqiang Yang et al. Hypertension. 2009 Dec.

Abstract

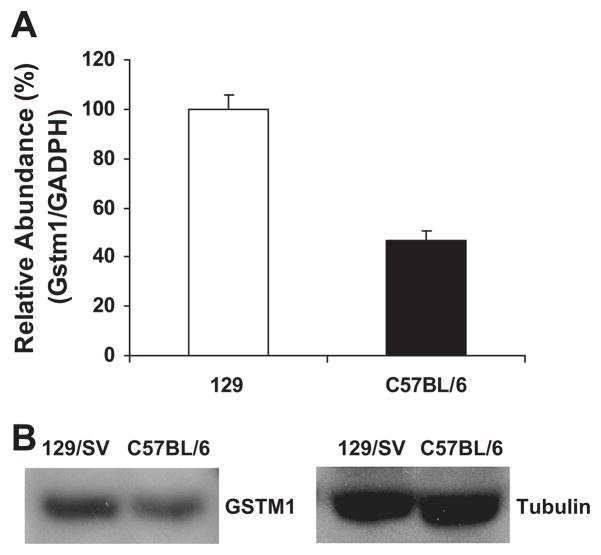
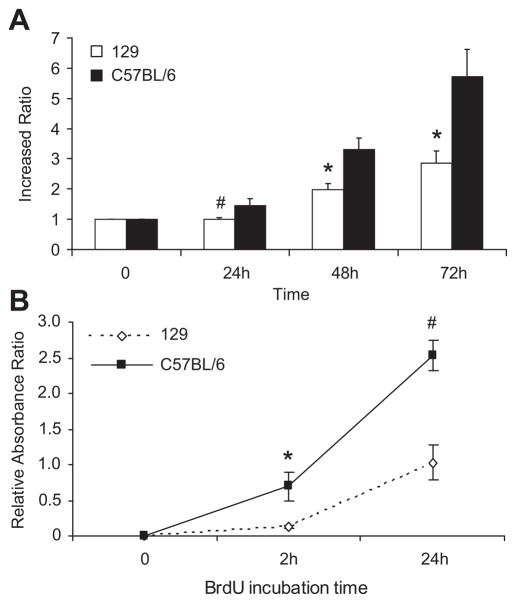
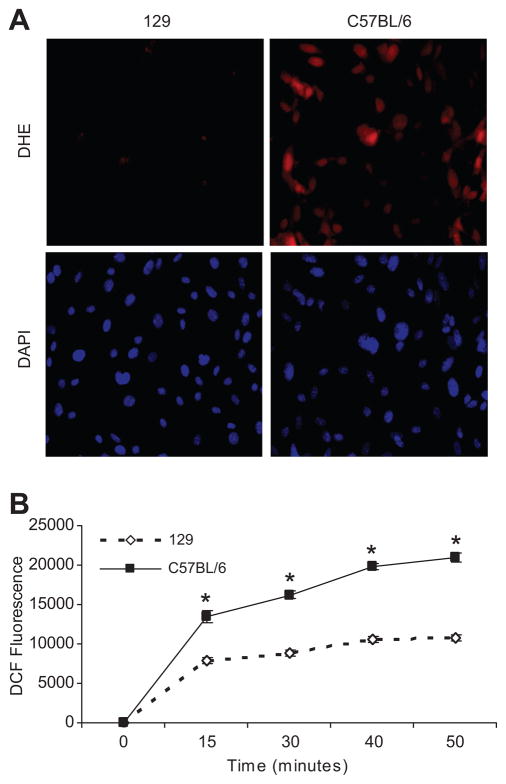
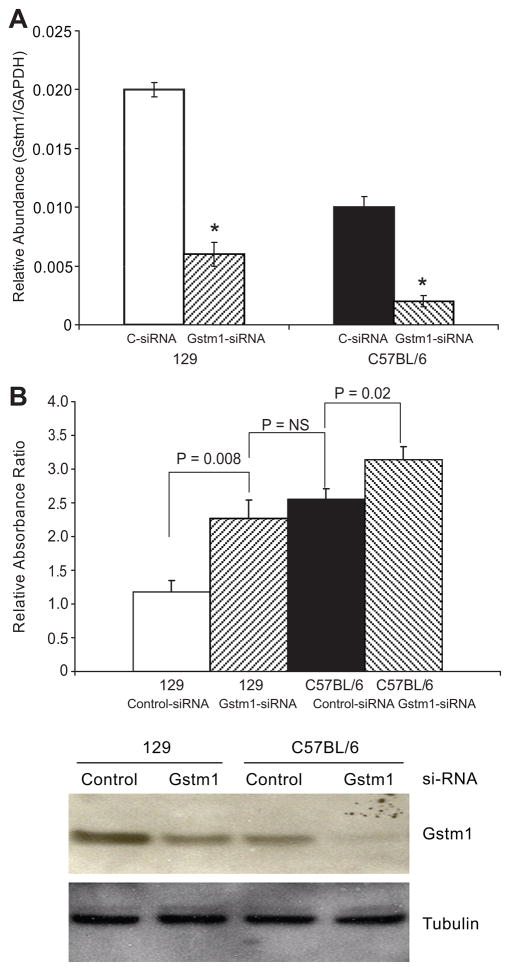
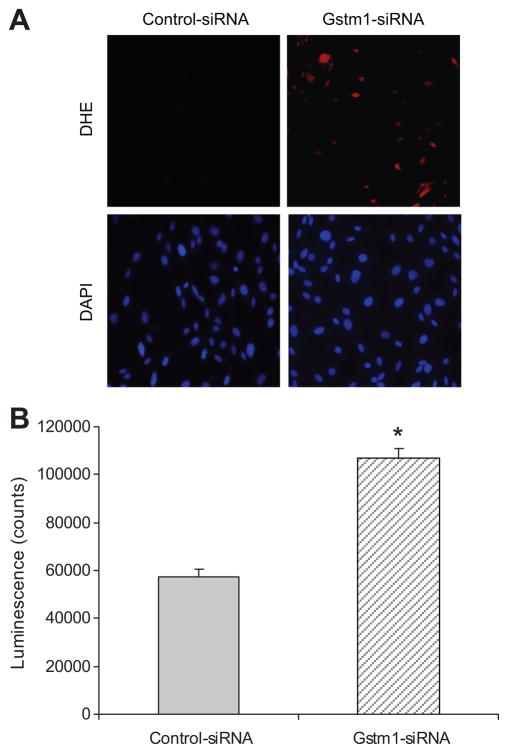
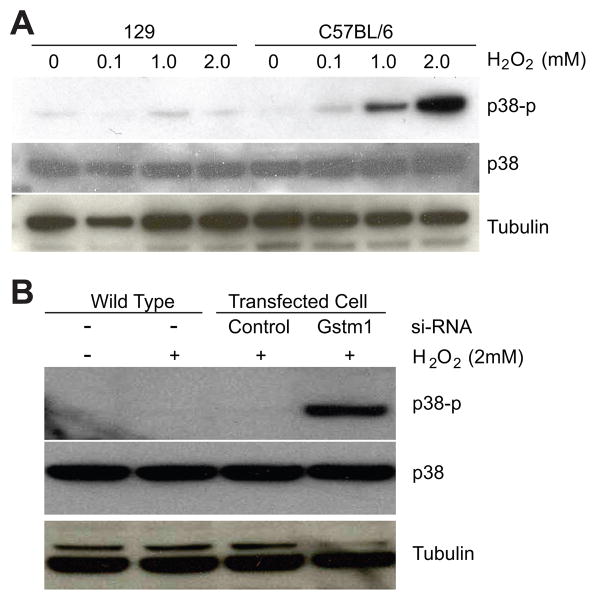
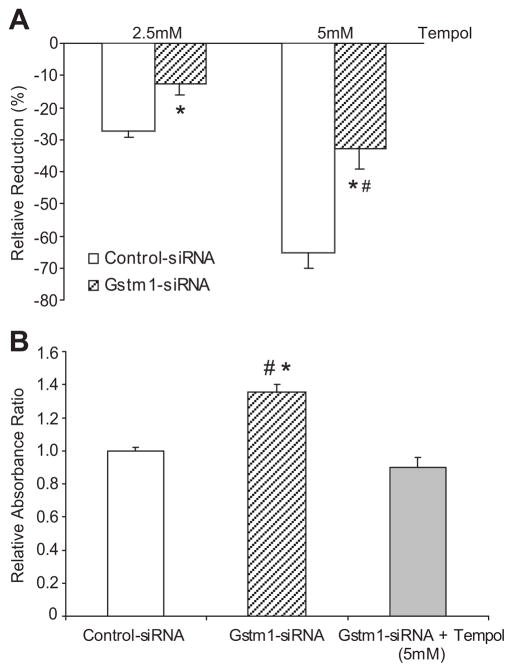
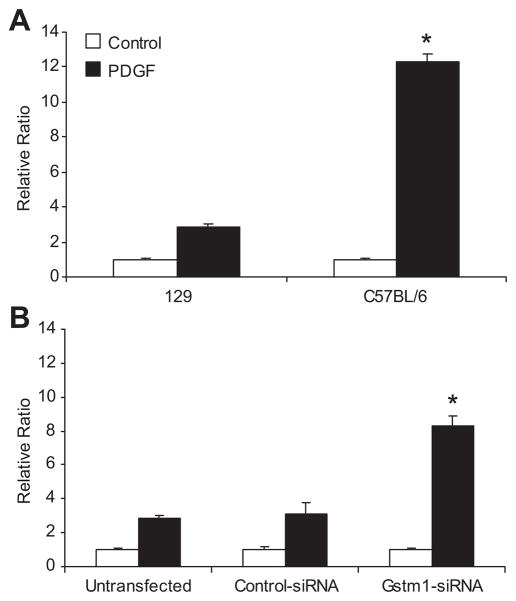
Glutathione S-transferase-micro1, GSTM1, belongs to a superfamily of glutathione S-transferases that metabolizes a broad range of reactive oxygen species and xenobiotics. Across species, genetic variants that result in decreased expression of the Gstm1 gene are associated with increased susceptibility for vascular diseases, including atherosclerosis in humans. We previously identified Gstm1 as a positional candidate in our gene mapping study for susceptibility to renal vascular injury characterized by medial hypertrophy and hyperplasia of the renal vessels. To determine the role of Gstm1 in vascular smooth muscle cells (VSMCs), we isolated VSMCs from mouse aortas. We demonstrate that VSMCs from the susceptible C57BL/6 mice have reduced expression of Gstm1 mRNA and its protein product compared with that of the resistant 129 mice. After serum stimulation, C57BL/6 VSMCs proliferate and migrate at a much faster rate than 129 VSMCs. Furthermore, C57BL/6 VSMCs have higher levels of reactive oxygen species and exhibit exaggerated p38 mitogen-activated protein kinase phosphorylation after exposure to H(2)O(2). To establish causality, we show that knockdown of Gstm1 by small interfering RNA results in increased proliferation of VSMCs in a dose-dependent manner, as well as in increased reactive oxygen species levels and VSMC migration. Moreover, Gstm1 small interfering RNA causes increased p38 mitogen-activated protein kinase phosphorylation and attenuates the antiproliferative effect of Tempol. Our data suggest that Gstm1 is a novel regulator of VSMC proliferation and migration through its role in handling reactive oxygen species. Genetic variants that cause a decremental change in expression of Gstm1 may permit an environment of exaggerated oxidative stress, leading to susceptibility to vascular remodeling and atherosclerosis.


Figures

Figure 1
Figure 1. Strain differences in expression of Gstm1 in vascular smooth muscle cells
A. Real time RT-PCR, expression of Gstm1 is compared to GAPDH housekeeping gene. Values are expressed as relative abundance, with 129 value used as reference value, p = 0.005 between 129 vs. C57BL/6, n = 3 each, performed in triplicates. B. Western blot, showing abundance of GSTM1 enzyme is lower in C57BL/6 compared to 129 VSMCs.
Figure 2
Figure 2. Strain differences in VSMC proliferation
A. By MTS assay, C57BL/6 VSMCs have higher proliferation rates compared to 129 VSMCs, # p = 0.09 at 24hr, * p ≤ 0.03 at 48 and 72 hr. B. By BrdU assay, differences in cell proliferation between strains were detected as early as 2 hr, * p = 0.01, # p = 0.001. VSMCs were obtained from aortas from 3 separate mice from each strain. Cell proliferation assays were done using serum, performed in triplicates, and repeated 4 times in separate experiments. Cell passages between 1–3 were used and matched between strains.
Figure 3
Figure 3. Strain differences in ROS production
A. DHE staining At relatively equal cell density determined by DAPI nuclear staining (lower left and right panels), there is very low level of DHE staining in the 129 cells (top left panel). However, in C57BL/6 VSMCs, there is dramatically higher level of DHE staining (top right panel), suggesting higher levels of superoxide. B. DCF-DA assay. The DCF fluorescent signal, a measure of H2O2 levels, is significantly higher in C57BL/6 VSMCs compared to 129, * p ≤ 0.001; n = 3 each, performed in triplicates in 3 experiments.
Figure 4
Figure 4. Effect of knockdown of Gstm1 by si-RNA
A. Gstm1-siRNA successfully decreased Gstm1 expression in both 129 and C57BL/6 VSMCs by 60–80%, * p < 0.0005 compared to control (C-siRNA); n = 3 each, performed in triplicates. B. Upper panel: Gstm1-siRNA resulted in significantly increased VSMC proliferation. 72 hours after si-RNA transfection, 129 VSMC treated with Gstm1-siRNA had significantly higher proliferation rate as 129 cells treated with control-siRNA (p = 0.008 129 Control-siRNA vs 129 Gstm1-siRNA), but similar proliferation rate as C57BL/6 cells treated with Control-siRNA (p = 0.40 129 Gstm1-siRNA vs C57BL/6 Control-siRNA). C57BL/6 cells treated with Gstm1-siRNA had an even higher proliferation rate than cells treated with control-siRNA (p = 0.02 C57BL/6 Control-siRNA vs C57BL/6 Gstm1-siRNA). N = 3 for each condition, performed in triplicates, in 3 separate experiments. Lower panel: Western analysis demonstrates successful knockdown of the enzyme in both cell lines compared to control-siRNA. Of note, Gstm1-siRNA reduced GSTM1 protein expression of 129 VSMCs to similar level as seen in C57BL/6 cells treated with control-siRNA. C57BL/6 cells treated with Gstm1-siRNA had barely detectable GSTM1 protein levels.
Figure 5
Figure 5. Effect of Gstm1 knockdown on superoxide levels in 129 VSMCs
A. DHE staining Compared to control-siRNA, Gstm1-siRNA resulted in significantly enhanced DHE staining (top panels) in 129 VSMCs. The bottom panels represent DAPI staining, showing relatively equal cell density. B. Lucigen-enhanced chemiluminescence assay. After transfection with Gstm1-siRNA, 129 VSMCs display significantly higher lucigenenin luminescence counts than 129 VSMCs transfected with control-siRNA, * p < 0.005, n = 3 each condition, performed in triplicates in 3 separate experiments.
Figure 6
Figure 6. Activation of p38 kinase in response to H2O2. A. Strain differences in p38 MAP kinase phosphorylation
129 VSMCs, with higher levels of Gstm1, demonstrated attenuated p38 phosphorylation after treatment with H2O2 compared to C57BL/6 VSMCs. B. Effect of Gstm1 knockdown on p38 phosphorylation in 129 VSMCs. Gstm1-siRNA transfection resulted in significant increase in p38 phosphorylation compared to control-siRNA or un-transfected conditions in 129 VSMCs exposed to H2O2.
Figure 7
Figure 7. A. Effect of Gstm1 knockdown on inhibition of VSMCs proliferation by TEMPOL
Gstm1-siRNA attenuates the anti-proliferative effect of TEMPOL by ~ 50%, * p ≤ 0.008 vs. control-siRNA, # p = NS for Gstm1-siRNA at 5 mM TEMPOL vs. control-siRNA at 2.5 mM TEMPOL. B: Effect of TEMPOL on proliferative effect of Gstm1 knockdown. TEMPOL blunts the proliferative effect of Gstm1-siRNA, * p = 0.006 versus control-siRNA, # p = 0.001 versus Gstm1-siRNA + TEMPOL (5 mM), p = NS for control-siRNA vs. Gstm1-siRNA + TEMPOL (5 mM). N = 3 for each condition, performed in triplicates in 3 separate experiments.
Figure 8
Figure 8. A. Strain differences in vascular smooth muscle cell migration
Basal VSMC migration was equivalent in 129 and C57BL/6 cell lines. However, after PDGF-BB stimulation, C57BL/6 VSMCs migrated at a much faster rate than 129 VSMCs, * p = 0.002, n = 3 each condition performed in triplicates. B. Effect of Gstm1 knockdown on migration of 129 VSMCs. Basal VSMC migration was similar between untransfected 129 cells and cells transfected with control- or Gstm1-siRNA. However, after stimulation with PDGF-BB, 129 VSMCs transfected with Gstm1-siRNA migrated at a much faster rate compared to untransfected or control-siRNA transfected cells, * p = 0.009, ANOVA, n = 3 each condition performed in triplicates in 3 separate experiments.

References

    1. Landi S, Norppa H, Frenzilli G, Cipollini G, Ponzanelli I, Barale R, Hirvonen A. Individual sensitivity to cytogenetic effects of 1,2:3,4-diepoxybutane in cultured human lymphocytes: influence of glutathione S-transferase M1, P1 and T1 genotypes. Pharmacogenetics. 1998;8:461–471. - PubMed
    1. Strange RC, Faulder CG, Davis BA, Hume R, Brown JA, Cotton W, Hopkinson DA. The human glutathione S-transferases: studies on the tissue distribution and genetic variation of the GST1, GST2 and GST3 isozymes. Ann Hum Genet. 1984;48:11–20. - PubMed
    1. Takahashi Y, Campbell EA, Hirata Y, Takayama T, Listowsky I. A basis for differentiating among the multiple human Mu-glutathione S-transferases and molecular cloning of brain GSTM5. J Biol Chem. 1993;268:8893–8898. - PubMed
    1. Guo J, Zimniak L, Zimniak P, Orchard JL, Singh SV. Cloning and expression of a novel Mu class murine glutathione transferase isoenzyme. Biochem J. 2002;366:817–824. - PMC - PubMed
    1. Hayes JD, Flanagan JU, Jowsey IR. Glutathione transferases. Annu Rev Pharmacol Toxicol. 2005;45:51–88. - PubMed

Publication types

MeSH terms