

Review
doi: 10.1038/nrg2632.
Epub 2009 Oct 13.
Spatial patterns of variation due to natural selection in humans
Affiliations
- PMID: 19823195
- PMCID: PMC3989104
- DOI: 10.1038/nrg2632
Item in Clipboard
Review
Spatial patterns of variation due to natural selection in humans
Nat Rev Genet.
2009 Nov.
Abstract
Empowered by technology and sampling efforts designed to facilitate genome-wide association mapping, human geneticists are now studying the geography of genetic variation in unprecedented detail. With high genomic coverage and geographic resolution, these studies are identifying loci with spatial signatures of selection, such as extreme levels of differentiation and correlations with environmental variables. Collectively, patterns at these loci are beginning to provide new insights into the process of human adaptation. Here, we review the challenges of these studies and emerging results, including how human population structure has influenced the response to novel selective pressures.
Figures

Arrows indicate how the allele frequencies of a selected allele (red) are expected to change over time, depending on the pattern of selective advantage of the allele (indicated in green above each plot). Vertical arrows represent the magnitude of increase expected due to selection. Horizontal arrows represent how dispersal homogenizes allele frequencies across space. For every selected allele, a representative neutral allele (blue) of similar average frequency is shown for comparison. In each case the allele is supposed to have arisen at location 3 along the x-axis (marked with a vertical dashed line); the spread will continue until the selected allele is at frequency 1 across the whole habitat. (A) Uniform selective advantage across space. If the novel variant is identically advantageous everywhere, the prediction is that as the variant increases in frequency it will be exceptionally concentrated around its geographic origin relative to a neutral variant of the same age. One effect of this is to create transiently enhanced levels of divergence among populations and clines in allele frequencies that reflect the geographic origin of the allele. (B, C) Non-uniform advantage across space. In scenario B, the novel allele is introduced to the regions in which it is most advantageous and increase in frequency rapidly in those regions. This can lead to transient correlations between allele frequency and the environmental factor that drives positive selection. In contrast, in scenario C, the novel allele arises in an area distant from where it is most advantageous. It will increase in frequency locally before spreading outwards, and its distribution will carry a strong signature of its geographic origin and be less reflective of spatial variation in selective advantage. These models assume selection acting on new mutations, which may not be the prevailing model in humans. Selection on pre-existing variation will complicate these simple scenarios.
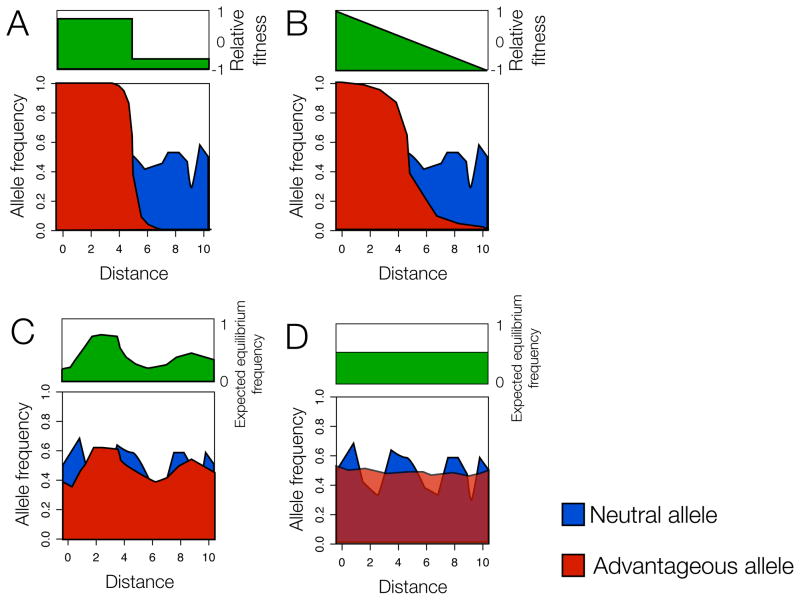
The panels illustrate the allele frequency dynamics of a novel variant (red) in a population, when the variant is advantageous in some locations and disadvantageous in others (A, B) or when local balancing selection (e.g. due to heterozygote advantage) is operating (C, D). These scenarios give rise to a stable polymorphism (where the novel and ancestral variant persist in the population). In these models the novel variant will not replace the ancestral variant - the novel variant will simply become more common in the regions where it is advantageous and can spread to via dispersal. For every selected allele, a representative neutral allele of similar average frequency (blue) is shown for reference. (A) Allele is favored in some patches and disfavored in others; in this situation, the allele will be fixed in the geographic patches where it is advantageous, and absent in regions where it is disadvantageous, with clines of frequency expected along the contact points between the two regions (B) Allele is favored in one geographic extreme and disfavoured in the opposite extreme. If the transition from being advantageous and disadvantageous occurs across a geographic range, rather than being abrupt, then broader clines are expected. (C) Local balancing selection that varies in intensity across space. When selection intensities vary across space, the local equilibrium frequencies will vary across space depending on the environmental factors driving selection and in turn generate correlations of allele frequencies with environmental factors that are not transient. A classic example is the sickle-cell mutation, which is found in high frequency in regions where malarial endemia is high and decreases in frequency as the prevalence of malaria decreases. (D) Local balancing selection that is constant across space; balancing selection can lead to exceptionally constant allele frequencies over space. Scenarios A–C will generate correlations between allele frequency and environmental factors underlying variation in selection.
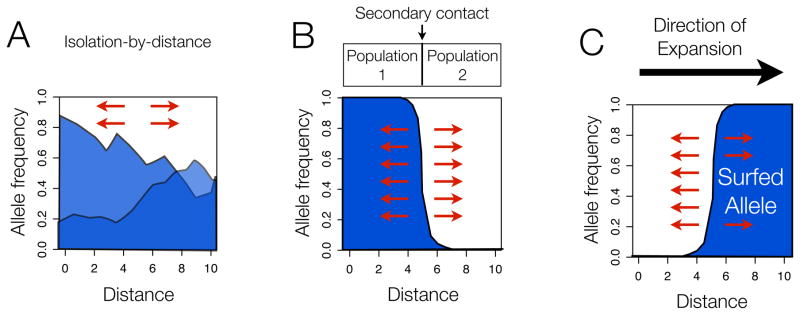
(A) Isolation by distance. Under models of isolation-by-distance, many neutral alleles will show cline patterns, especially along geographic axes with the least gene flow. (B) Secondary contact between two populations. With secondary contact, neutral alleles will transiently show a cline pattern at the contact zone between the two populations. Note that the allele frequency in the two source populations need not be 0 and 1, as shown here; clines along the secondary contact zone will form even if the allele frequency difference between the two populations is more modest. (C) Expansion into new territory giving rise to serial founder effects and “allele surfing”. The cartoon depicts the distribution immediately following the expansion and an extreme case of surfing where the allele has gone completely to fixation. In each case, arrows indicate that none of these patterns is stable -- dispersal and drift will erode the clines over time. In all three models, cline patterns that arise can potentially be confused with cline patterns expected as a result of selection.
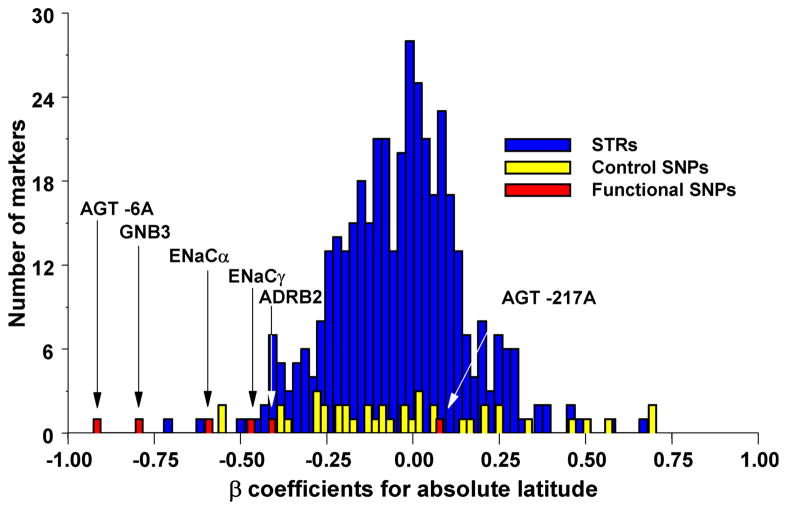
Outlier approaches simply rank all SNPs from a large-scale survey based on the value of a test statistic, e.g. FST, and then take all SNPs above a specified cut-off as targets of selection. This is based on the assumption that selection is sufficiently strong to generate extreme spatial patterns compared to the rest of the genome. The power and accuracy of these approaches depends on a number of variables, including the proportion of loci affected by selection and the strength of selection. In a similar vein, specific candidate SNPs can be evaluated against a large collection of SNPs to determine if the spatial patterns at candidate SNP is unusual relative to the rest of the genome. (A) Correlation between allele frequency and latitude for candidate susceptibility SNPs for hypertension (in red) compared to random microsatellites (STRs; in blue) and SNPs (in yellow) . (B) Differentiation of allele frequency in loci (A–K) involved in natural variation in skin pigmentation compared to a large collection of random SNPs . The dotted line shows the position beyond which 5% of the random SNPs fall, and the solid line the position beyond which 1% of the random SNPs fall.
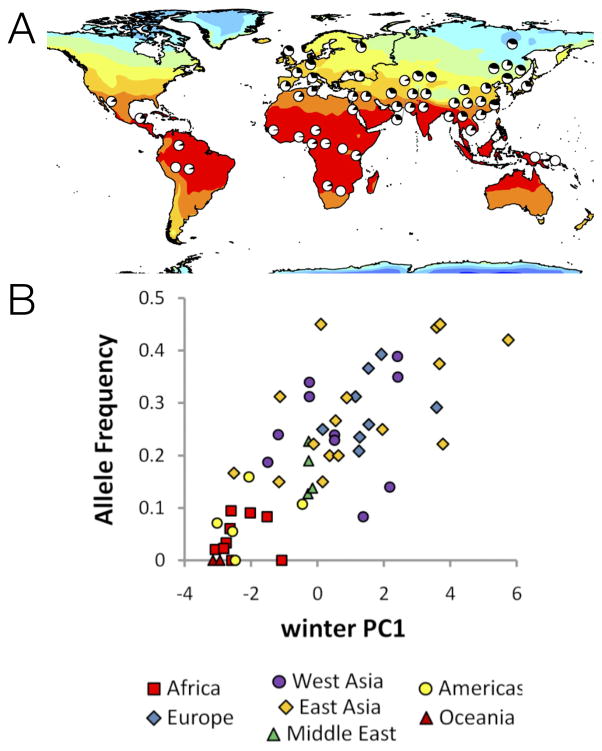
(A) Pie charts show the frequency of the derived allele at SNP rs12946049 in the RPTOR gene in the HGDP panel. Color intensities represent the maximum temperature in the winter. (B) Allele frequency at rs12946049 as a function of distance from the equator. Qualitatively, the correlation is convincing for three reasons. First, the variation correlates strongly with an environmental feature in ways that depart from background spatial patterns (e.g., distantly related populations sharing the same environment – tropical Americas, Oceania and sub-Saharan Africa – have similar allele frequencies). Second, the correlation exists within multiple world regions, as shown in panel B. Interestingly, the extent of allele frequency differentiation at this SNP is not extreme (ranging from 0 to 0.5 frequency).
References
-
- Cavalli-Sforza LL, Menozzi P, Piazza A. History and geography of human genes. Princeton University Press; Princeton, N.J: 1994.
-
- Roychoudhury AK, Nei M. Human Polymorphic Genes World Distribution. Oxford University Press; New York - Oxford: 1988.
-
- Haldane JBS. The rate of mutation of human genes. Hereditas. 1949;35 (Suppl 1):267–272.
-
- Fisher R. The wave of advance of advantageous genes. Ann Eugen. 1937;7:355–369.
-
- Roberts DF. Human pigmentation: its geographical and racial distribution and biological significance. J Soc Cosmetic Chem. 1977;28:329–342.
Publication types
MeSH terms
Grants and funding
LinkOut - more resources
Full Text Sources
Other Literature Sources
