

Review
doi: 10.1371/journal.pmed.1000161.
Epub 2009 Oct 13.
The Comparative Oncology Trials Consortium: using spontaneously occurring cancers in dogs to inform the cancer drug development pathway
Affiliations
- PMID: 19823573
- PMCID: PMC2753665
- DOI: 10.1371/journal.pmed.1000161
Item in Clipboard
Review
The Comparative Oncology Trials Consortium: using spontaneously occurring cancers in dogs to inform the cancer drug development pathway
PLoS Med.
2009 Oct.
Abstract
Chand Khanna and colleagues describe the work of the Comparative Oncology Trials Consortium (COTC), which provides infrastructure and resources to integrate naturally occurring dog cancer models into the development of new human cancer drugs, devices, and imaging techniques.
Conflict of interest statement
The authors have declared that no competing interests exist.
Figures
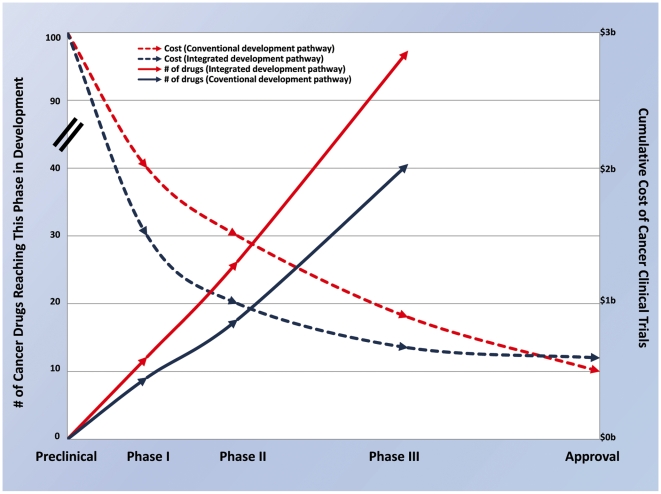
This is a theoretical illustration of 100 preclinical agents that may be evaluated by either a conventional or an integrated and comparative drug development path. Data for transition rates and costs of Phase I, II, and III trials are based on published cost estimates and reported clinical phase transition probabilities for investigational oncology compounds from the 20 largest firms (by pharmaceutical sales in 2005) from 1993 to 2002 ,. Estimates used to derive a vision of the benefit of an integrated approach to drug development are based, in part, on estimates of transition and approval rates for non-oncology therapeutic areas where informative preclinical models exist . Relative to the conventional development path, the integrated development path is characterized by improved success early in clinical development and a reduction in drug failures late in clinical development. Conventional oncology drug development results in approximately 40% of eligible agents transitioning from preclinical to Phase I, 75% from Phase I to II, 60% from Phase II to III, and 55% from Phase III to approval . Therefore, for every 100 preclinical candidates, only ten new drugs will reach the clinic. Of most significance are failures that occur late in the development path (i.e., after Phase II or Phase III evaluation). With an integrated approach, more toxic and ineffective agents may be eliminated prior to Phase I (estimate 30 agents now entering Phase I trials versus 40 in the conventional pipeline). Attrition in Phase I may be minimized (estimated 87.5% success rate) and an additional 30% of drugs may be removed from development prior to Phase II based on comparative studies that demonstrate poor pharmacokinetics, pharmacodynamics, or activity (estimate 18 agents now entering Phase II trials versus 30 in the conventional pipeline). Deprioritization (from above) of these drugs will improve the Phase II success rate (estimate 90%). Data from comparative studies will result in the removal of 20% of remaining drugs prior to Phase III based on lack of efficacy in the adjuvant setting, thereby improving success in Phase III and leading to 90% of Phase III agents receiving FDA approval (compared to 55% in the conventional pipeline). In this model, 12 new drugs out of every 100 preclinical candidates will reach the clinic. Using estimates for Phase I, II, and III trials of US$15.2 million, US$23.5 million, and US$86.3 million per trial respectively , the total clinical trial expenditures for developing 100 preclinical agents is US$2.87 billion using conventional methods. Using the hypothetical improvements described above that result from the integrated approach the clinical costs for development will be US$2.03 billion . Factoring in additional costs for comparative studies with this approach of US$150,000 for studies conducted in the preclinical setting, US$250,000 for studies conducted before or during Phases I–II human trials and US$1 million for studies conducted before Phases II–III studies, the total cost of development is estimated at US$2.07 billion. The result may be a decrease in average clinical trial costs per approved drug from US$290 million to US$173 million .
References
-
- DiMasi JA, Grabowski HG. Economics of new oncology drug development. J Clin Oncol. 2007;25:209–216. - PubMed
-
- DiMasi JA, Hansen RW, Grabowski HG. The price of innovation: new estimates of drug development costs. J Health Econ. 2003;22:151–185. - PubMed
-
- Roberts TG, Jr, Lynch TJ, Jr, Chabner BA. The phase III trial in the era of targeted therapy: unraveling the “go or no go” decision. J Clin Oncol. 2003;21:3683–3695. - PubMed
-
- Adams CP, Brantner VV. Estimating the cost of new drug development: is it really $802 million? Health Aff. 2006;25:420–428. - PubMed
Publication types
MeSH terms
Substances
LinkOut - more resources
Full Text Sources
Other Literature Sources
Medical
