. 2009 Oct 12;4(10):e7338.
doi: 10.1371/journal.pone.0007338.

Förster resonance energy transfer measurements of ryanodine receptor type 1 structure using a novel site-specific labeling method

Affiliations

Förster resonance energy transfer measurements of ryanodine receptor type 1 structure using a novel site-specific labeling method

James D Fessenden. PLoS One. .

Abstract

Background: While the static structure of the intracellular Ca(2+) release channel, the ryanodine receptor type 1 (RyR1) has been determined using cryo electron microscopy, relatively little is known concerning changes in RyR1 structure that accompany channel gating. Förster resonance energy transfer (FRET) methods can resolve small changes in protein structure although FRET measurements of RyR1 are hampered by an inability to site-specifically label the protein with fluorescent probes.

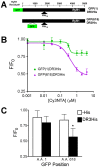
Methodology/principal findings: A novel site-specific labeling method is presented that targets a FRET acceptor, Cy3NTA to 10-residue histidine (His) tags engineered into RyR1. Cy3NTA, comprised of the fluorescent dye Cy3, coupled to two Ni(2+)/nitrilotriacetic acid moieties, was synthesized and functionally tested for binding to His-tagged green fluorescent protein (GFP). GFP fluorescence emission and Cy3NTA absorbance spectra overlapped significantly, indicating that FRET could occur (Förster distance = 6.3 nm). Cy3NTA bound to His(10)-tagged GFP, quenching its fluorescence by 88%. GFP was then fused to the N-terminus of RyR1 and His(10) tags were placed either at the N-terminus of the fused GFP or between GFP and RyR1. Cy3NTA reduced fluorescence of these fusion proteins by 75% and this quenching could be reversed by photobleaching Cy3, thus confirming GFP-RyR1 quenching via FRET. A His(10) tag was then placed at amino acid position 1861 and FRET was measured from GFP located at either the N-terminus or at position 618 to Cy3NTA bound to this His tag. While minimal FRET was detected between GFP at position 1 and Cy3NTA at position 1861, 53% energy transfer was detected from GFP at position 618 to Cy3NTA at position 1861, thus indicating that these sites are in close proximity to each other.

Conclusions/significance: These findings illustrate the potential of this site-specific labeling system for use in future FRET-based experiments to elucidate novel aspects of RyR1 structure.


Conflict of interest statement

Competing Interests: The author has declared that no competing interests exist.

Figures

Figure 1
Figure 1. TLC analysis and structure of Cy3NTA.
(A) Products from reactions consisting of Cy3-bis-succinimidyl ester alone (lane 1), Cy3-mono-succinimidyl ester and AB-NTA (lane 2), and Cy3-bis-succinimidyl ester and AB-NTA (lane 3) separated by TLC as described in Methods. Arrow indicates Cy3NTA used for FRET studies. Rf = relative index of mobility. (B) Predicted structure of Cy3NTA. Locations of Cy3 and the two NTA/Ni2+ moieties are indicated.
Figure 2
Figure 2. Cy3NTA quenches fluorescence of a His-tagged GFP.
(A) Normalized GFP emission (green, λEx = 476 nm) and Cy3NTA absorbance (red) spectra. (B) Time-based measurements of GFPHis6 fluorescence normalized to initial intensity (F0). Arrow indicates point of addition of either 4 µM NiCl2 (blue trace), Ni/NTA (green) or Cy3NTA (red). Arrowhead indicates addition of 5 mM EDTA. (C) Time-based fluorescence measurements of GFP either lacking (-His; blue trace) or containing an N-terminal His tag with either 6 (green) or 10 (red) residues. Arrowheads indicate additions of Cy3NTA at the (µM) concentrations indicated. Arrow indicates addition of 5 mM EDTA. (D) Detailed fluorescence quenching curves for Cy3NTA binding to each of the 3 GFP constructs. Values are averages of GFP fluorescence after addition of Cy3NTA. Quenching data for His-tagged GFP constructs were fit as described in Methods.
Figure 3
Figure 3. GFP-RyR1 fusion proteins release Ca2+ in response to caffeine stimulation.
(A) GFP-RyR1 fusion constructs tested for FRET. Bars represent amino acid sequence of GFP (green) and RyR1 (black). The sequence of the glycine rich linker between GFP and RyR1 as well as positions of inserted His10 tags are shown. Scale indicates RyR1 amino acid number. (B) Caffeine-induced Ca2+ transients in HEK-293T cells expressing RyR1 constructs measured using Fura-2 based Ca2+ imaging. A graded series of caffeine concentrations were perfused at the times and concentrations indicated (black bars). Individual representative traces indicate changes in Fura-2 fluorescence excitation F340/F380 ratio. Ctrl indicates untransfected cells. Calibration bar = 0.2 340/380 ratio units vs. 50 s. (C) Normalized caffeine dose response curves for the indicated constructs. Values represent mean +/− S.E.M. for 19–22 cells per construct. EC50 values were calculated from the midpoint of these curves as described in Methods. No statistical difference (1-way analysis of variance (ANOVA); p<0.05) between EC50 values was observed.
Figure 4
Figure 4. His-tagged GFP-RyR1 fusion proteins bind to NTA-agarose.
NTA-agarose-based fractionation of crude lysates from HEK-293T cells expressing GFP-RyR1 fusion proteins. Columns were washed as indicated (dotted lines). Datum points indicate relative levels of RyR immunoreactivity in consecutive 120 µl fractions quantified by an RyR-specific ELISA assay as described in Methods.
Figure 5
Figure 5. Cy3NTA quenches GFP-RyR1 (N-term His) fluorescence via FRET.
HEK-293T cells expressing GFP-RyR1 (N-term His) were examined for GFP (panels A,C,E) and Cy3 fluorescence (B,D,E) either before (A,B) or after (C,D) a 30 min incubation with 2 µM Cy3NTA. Cy3 fluorescence was observed both in HEK-293T cells expressing GFP-RyR1(N-term His) (asterisks) and untransfected cells. Cy3 was then selectively bleached via 20 min illumination with 550 nm light resulting in an increase in GFP fluorescence (panel E) and a decrease in Cy3 fluorescence (F).
Figure 6
Figure 6. Cy3NTA quenches His-tagged GFP-RyR1 fluorescence in a concentration-dependent manner.
(A) Concentration dependence of Cy3NTA quenching of GFP-RyR1 (N-term His) fluorescence. The indicated Cy3NTA concentrations were added to HEK-293T cells expressing GFP-RyR1 (N-term His) at the time point indicated (arrowhead) and the change in GFP fluorescence normalized to initial fluorescence (F/F0) was measured. Pre-incubation with 5 mM EDTA (top trace) abolished fluorescence quenching by Cy3NTA. (B) Cy3NTA concentration dependence of quenching of the indicated GFP-RyR1 fusion proteins expressed in HEK-293T cells. Values represent mean +/− S.E.M. for 7–14 cells. EC50 and FRET efficiency values were determined from these curves as described in Methods.
Figure 7
Figure 7. Cy3NTA can be used to measure FRET between internal sites on RyR1.
(A) GFP-RyR1 fusion constructs containing a His10 tag in divergent region 3 at amino acid residue 1861. Bars represent amino acid sequence of GFP (green) and RyR1 (black). For construct GFP(618)DR3His, GFP inserted at amino acid residue 618 was flanked by poly-glycine segments as indicated in Methods. Scale indicates RyR1 amino acid number. (B) Cy3NTA concentration-dependence of quenching of GFP(1)DR3His (green trace) and GFP(618)DR3His (purple) expressed in HEK-293T cells. Data was fit to determine EC50 and the level of energy transfer (E) as described in Methods. (C) Degree of quenching of the indicated GFP-RyR1 fusion proteins by 1 µM Cy3NTA. Asterisk indicates significant level of quenching (p<0.01) relative to GFP-RyR1 (-His) as determined using 1-way ANOVA followed by a Dunnett's post test.

References

    1. Reiken S, Lacampagne A, Zhou H, Kherani A, Lehnart SE, et al. PKA phosphorylation activates the calcium release channel (ryanodine receptor) in skeletal muscle: defective regulation in heart failure. J Cell Biol. 2003;160:919–928. - PMC - PubMed
    1. Wagenknecht T, Grassucci R, Frank J, Saito A, Inui M, et al. Three-dimensional architecture of the calcium channel/foot structure of sarcoplasmic reticulum. Nature. 1989;338:167–170. - PubMed
    1. Wang R, Chen W, Cai S, Zhang J, Bolstad J, et al. Localization of an NH(2)-terminal disease-causing mutation hot spot to the “clamp” region in the three-dimensional structure of the cardiac ryanodine receptor. J Biol Chem. 2007;282:17785–17793. - PMC - PubMed
    1. Liu Z, Wang R, Zhang J, Chen SR, Wagenknecht T. Localization of a disease-associated mutation site in the three-dimensional structure of the cardiac muscle ryanodine receptor. J Biol Chem. 2005;280:37941–37947. - PMC - PubMed
    1. Orlova EV, Serysheva II, van Heel M, Hamilton SL, Chiu W. Two structural configurations of the skeletal muscle calcium release channel. Nat Struct Biol. 1996;3:547–552. - PubMed

Publication types

MeSH terms