. 2009 Oct 12;4(10):e7422.
doi: 10.1371/journal.pone.0007422.

LRP1 receptor controls adipogenesis and is up-regulated in human and mouse obese adipose tissue

Affiliations

LRP1 receptor controls adipogenesis and is up-regulated in human and mouse obese adipose tissue

Olivier Masson et al. PLoS One. .

Abstract

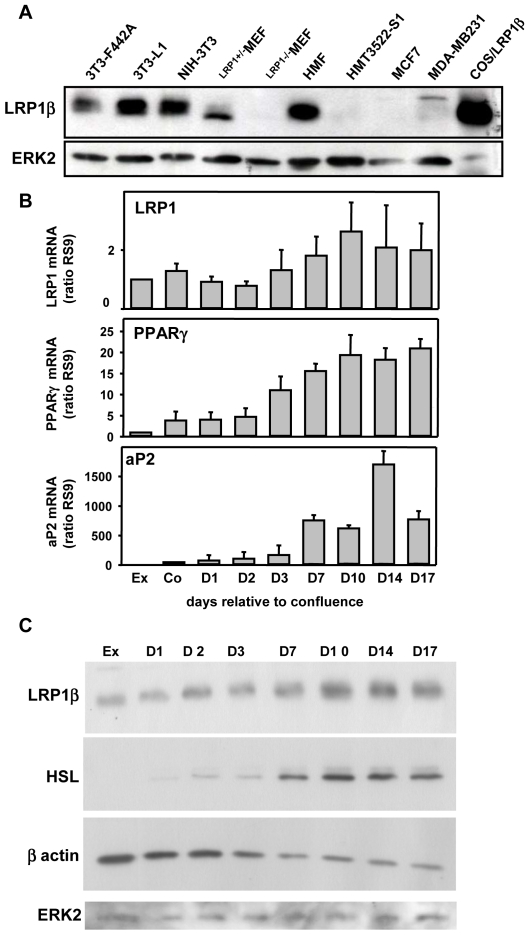
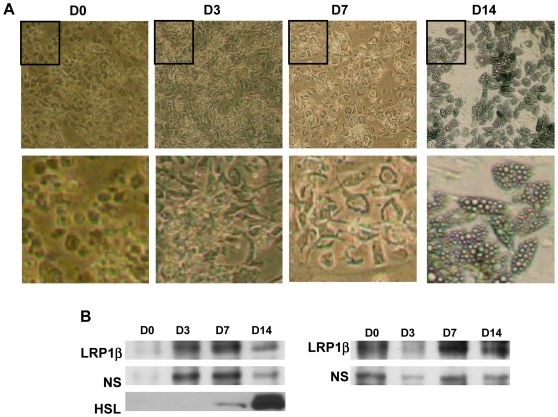
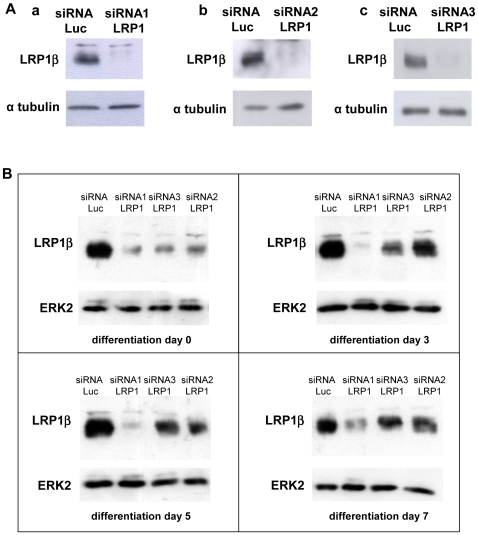
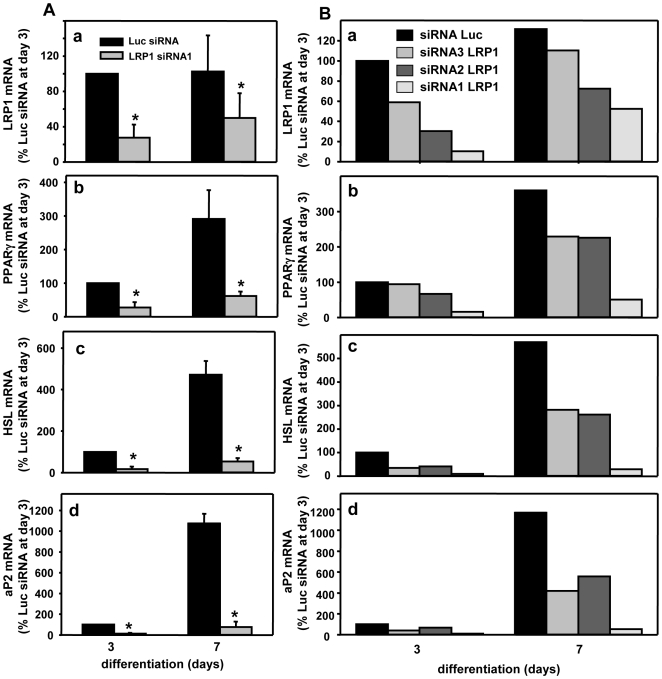
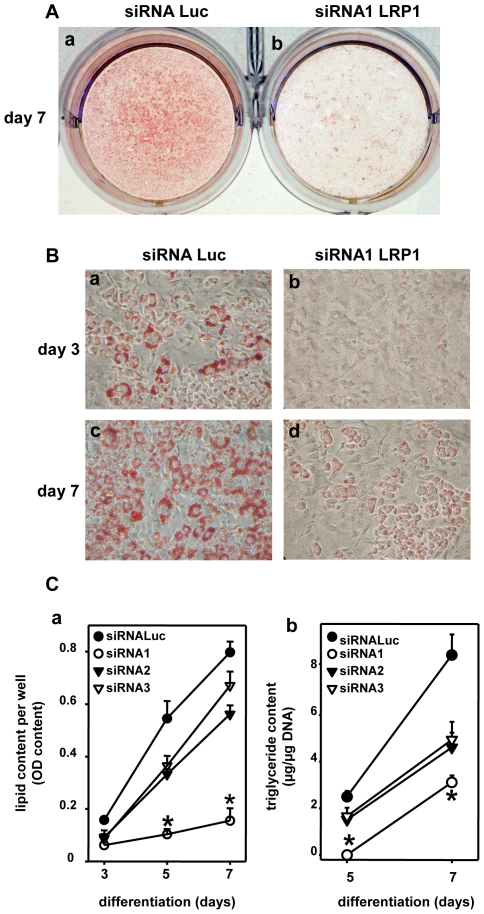
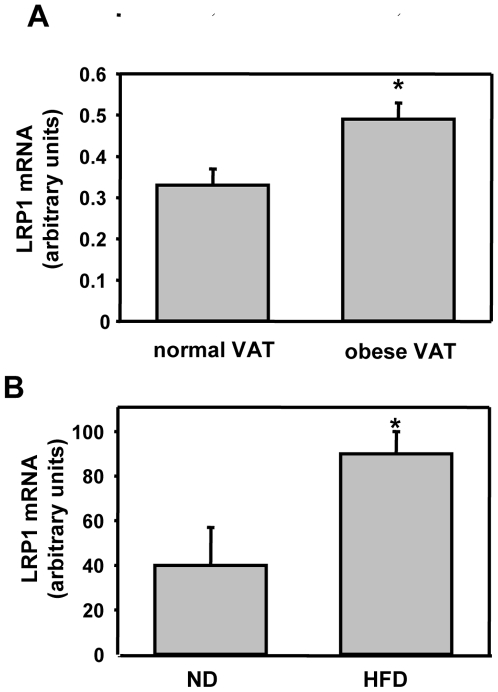
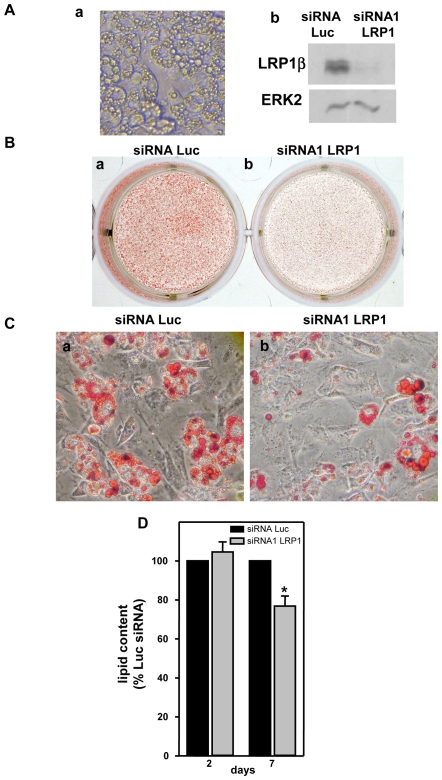
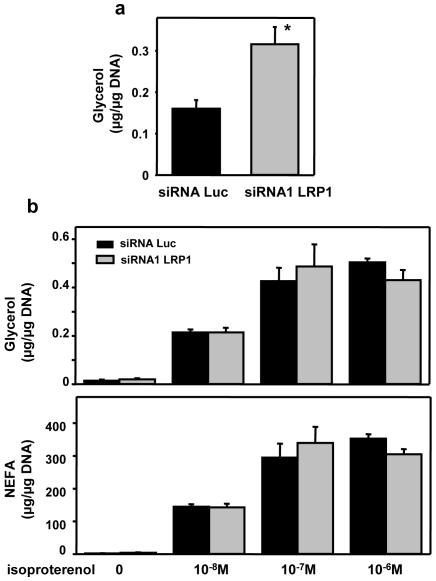
The cell surface low-density lipoprotein receptor-related protein 1, LRP1, plays a major role in lipid metabolism. The question that remains open concerns the function of LRP1 in adipogenesis. Here, we show that LRP1 is highly expressed in murine preadipocytes as well as in primary culture of human adipocytes. Moreover, LRP1 remains abundantly synthesised during mouse and human adipocyte differentiation. We demonstrate that LRP1 silencing in 3T3F442A murine preadipocytes significantly inhibits the expression of PPARgamma, HSL and aP2 adipocyte differentiation markers after adipogenesis induction, and leads to lipid-depleted cells. We further show that the absence of lipids in LRP1-silenced preadipocytes is not caused by lipolysis induction. In addition, we provide the first evidences that LRP1 is significantly up-regulated in obese C57BI6/J mouse adipocytes and obese human adipose tissues. Interestingly, silencing of LRP1 in fully-differentiated adipocytes also reduces cellular lipid level and is associated with an increase of basal lipolysis. However, the ability of mature adipocytes to induce lipolysis is independent of LRP1 expression. Altogether, our findings highlight the dual role of LRP1 in the control of adipogenesis and lipid homeostasis, and suggest that LRP1 may be an important therapeutic target in obesity.


Conflict of interest statement

Competing Interests: The authors have declared that no competing interests exist.

Figures

Figure 1
Figure 1. Expression of LRP1 in mouse adipocytes during adipogenesis.
(A) LRP1β protein expression. Expression of LRP1β, and ERK2 were analysed by immunoblotting in preadipocytes (3T3-F442A, 3T3-L1), fibroblasts (NIH-3T3, LRP1−/−MEF, LRP1+/−MEF, HMF), and epithelial (HMT3522-S1, MCF7, MDA-MB-231) cells. COS cells transfected with LRP1β serve as a positive control for LRP1β expression. ERK2 was used as a loading control. (B) LRP1 mRNA expression during adipogenesis. RNA expression of LRP1, PPARγ and aP2 were analysed in exponentially growing 3T3F442A preadipocytes (Ex), in 3T3F442A grown to confluence (Co) and after the indicated time of culture in adipogenic differentiation medium by real-time quantitative RT-PCR. Mean ± SD of 5 independent experiments quantified in duplicate is shown. LRP1 mRNA expression was not statistically different during adipogenesis. (C) LRP1β protein expression during adipogenesis. Protein expression of LRP1β, HSL, βactin and ERK2 were analysed by immunoblotting in exponentially growing 3T3F442A preadipocytes (Ex) and after the indicated time following induction of the differentiation process. ERK2 was used as loading control. Similar results were observed in 3 independent experiments. LRP1β protein expression was not statistically different during adipogenesis.
Figure 2
Figure 2. Expression of LRP1 during adipogenesis in human.
(A) Micrographs of human adipocytes. Human preadipocytes isolated from subcutaneous adipose tissue digested with collagenase and separated from the stromal vascular fraction were grown for 0, 3, 7 and 14 days in the presence of the adipogenic medium as illustrated in the micrographs. A representative experiment is shown. (B) LRP1β protein expression during adipogenesis. Protein expression of LRP1β and HSL was analysed by immunoblotting after the indicated time following induction of the differentiation process. NS, non specific band showing sample loading. Two independent experiments (left and right panels) are presented.
Figure 3
Figure 3. Inhibition of LRP1 expression by silencing during adipocyte differentiation.
(A) Silencing of LRP1 by siRNAs. 3T3F442A preadipocytes were transiently transfected with Luc siRNA or LRP1 siRNAs. LRP1β protein expression was monitored by immunoblotting 2 days post-transfection. α tubulin was used as a loading control. A representative experiment out of 3 is shown. (B) Time-course of LRP1β protein expression after Luc siRNA or LRP1 siRNAs transfection during adipogenesis. 3T3F442A preadipocytes were transiently transfected with Luc siRNA or LRP1 siRNAs. Two-days post-transfection, LRP1β protein expression was monitored by immunoblotting 0, 3, 5 or 7 days after differentiation induction. ERK2 was used as a loading control.
Figure 4
Figure 4. Silencing of LRP1 inhibits expression of adipocyte differentiation markers in a LRP1 dose-dependent manner.
(A) mRNA expression of LRP1, PPARγ, HSL and aP2 in LRP1 siRNA1-silenced preadipocytes. RNA expression of LRP1, PPARγ, HSL and aP2 was analysed in 3T3F442A preadipocytes transfected with Luc siRNA or LRP1 siRNA1. RNA was quantified by RT-PCR in 3T3F442A cells after 3 and 7 days in adipogenic differentiation medium. Mean ± SD of 4 independent experiments is shown. *P<0.025 when compared with Luc siRNA transfected cells. (B) Inhibition of PPARγ, HSL and aP2 mRNA expression in LRP1-silenced preadipocytes in a LRP1 dose-dependent manner. RNA levels of LRP1, PPARγ, HSL and aP2 in 3T3F442A preadipocytes transfected with Luc siRNA or the 3 LRP1 siRNA1-3 were performed as described in panel A.
Figure 5
Figure 5. LRP1 expression is required for adipogenesis.
(A) Staining of neutral lipids. Plates of 3T3F442A transfected with Luc siRNA (panel a) or LRP1 siRNA1 (panel b) at day 7 are presented. Two-days post Luc or LRP1 siRNA transfection, confluent 3T3F442A cells were grown in the presence of the adipogenic differentiation medium. After 7 days of differentiation, the extent of cellular lipid accumulation was revealed by oil Red O staining. A representative experiment out of 3 is shown. (B) Micrographs of 3T3F442A preadipocytes. Cells were transfected with Luc siRNA (panels a and c) or LRP1 siRNA1 (panels b and d) and micrographs were performed after 3 (panels a and b) and 7 (panels c and d) days of differentiation. A representative experiment out of 3 is shown. (C) Quantification of neutral lipids and triglycerides. In panel a, lipid content was quantified at 3, 5 and 7 days of differentiation in 3T3F442A transfected with Luc or LRP1 siRNAs. Mean ± SD of 3 independent experiments is shown. *P<0.0025 when compared with Luc siRNA transfected cells. In panel b, triglycerides were quantified at day 5 and 7 of differentiation in 3T3F442A transfected with Luc or LRP1 siRNAs. Results were normalised per µg of DNA. Data are presented as mean ± SD of an experiment performed in triplicate. *P<0.0025 when compared with Luc siRNA transfected cells.
Figure 6
Figure 6. Silencing of LRP1 in pre-adipocytes inhibits lipolysis.
(A) Basal lipolysis. Glycerol release in the medium after 18 h was quantified in 3T3F442A transfected with Luc or LRP1 siRNA1 after 7 days of differentiation. Results were normalised with µg of DNA. Data are presented as mean ± SD of one experiment performed in quadruplicate. P<0.025 when compared with Luc siRNA transfected cells. (B) Induced lipolysis. Glycerol and non esterified fatty acid (NAFA) releases were quantified after 7 days of differentiation in 3T3F442A cells transfected with Luc or LRP1 siRNA1 and treated with increasing concentrations of isoproterenol. Results were normalised per µg of DNA. Mean ± SD of an experiment performed in quadruplicate is presented. P<0.025 when compared with Luc siRNA transfected cells.
Figure 7
Figure 7. LRP1 expression is up-regulated in human and mouse obese adipose tissues.
(A) LRP1 expression in adipose tissue from lean and obese human. LRP1 mRNA level was quantified in human intra-abdominal visceral adipose tissue samples (VAT) obtained from 27 morbide grade III obese patients (44.5+/−1.8 year old, BMI: 47.6 +/− 1.3 kg/m2) before a bariatric surgery and from 10 control patients undergoing abdominal lipectomy for plastic surgery (42.7 +/− 4.5 year old, BMI: 23.1 +/− 3.3 kg/m2). Results are mean values +/− SEM, *P<0.01 when compared with controls (normal VAT). (B) LRP1 expression in adipocytes from obese mouse. LRP1 mRNA level was quantified in adipocytes isolated from intra-abdominal adipose tissues from 30-week-old overweight C57Bl6/J mice fed in high-fat diet (HFD) and from C57Bl6/J control mice fed in normal diet (ND). Results are mean value +/− SEM from 5 mice for ND group and 4 mice for HFD group. *P<0.05 when compared with ND controls.
Figure 8
Figure 8. LRP1 silencing in fully-differentiated adipocytes leads to lipid-depleted cells.
(A) Silencing of LRP1 in fully-differentiated adipocyte. 3T3F442A pre-adipocytes were maintained for 10 days in adipogenic differentiation medium (panel a) and were transfected with Luc siRNA or LRP1 siRNA1. LRP1β protein expression was monitored by immunoblotting 2 days post-transfection (panel b). ERK2 was used as a loading control. (B) Staining of neutral lipids. Plates of differentiated 3T3F442A transfected with Luc siRNA (panel a) or LRP1 siRNA1 (panel b) are shown. After siRNA transfection, 3T3F442A mature adipocytes were grown in DMEM + 10% FCS. The extent of cellular lipid accumulation was determined at day 2 and 7 of culture by oil Red O staining. A representative experiment out of 3 is shown. (C) Micrographs of 3T3F442A adipocytes. Micrographs of differentiated adipocytes transfected with Luc siRNA (panel a) or LRP1 siRNA1 (panel b) were performed 7 days post-transfection. A representative experiment out of 3 is shown. (D) Quantification of lipid content. Lipid content was quantified at days 2 and 7 post-tranfection of differentiated adipocytes transfected with Luc or LRP1 siRNA1. Mean ± SD of 3 independent experiments is shown. *P<0.005 when compared with Luc siRNA transfected cells.
Figure 9
Figure 9. Analysis of lipolysis in fully-differentiated adipocytes silenced for LRP1.
Adipocytes differentiated for 10 days were transfected with Luc siRNA or LRP1 siRNA1. Two days post-transfection, glycerol release over 18 h (panel a) and glycerol and NEFA release after isoproterenol stimulation (panel b) were quantified. Results were normalised per µg of DNA. Mean ± SD of an experiment in quadruplicate is shown. P<0.025.

References

    1. Kahn SE, Hull RL, Utzschneider KM. Mechanisms linking obesity to insulin resistance and type 2 diabetes. Nature. 2006;444(7121):840–846. - PubMed
    1. He W, Barak Y, Hevener A, Olson P, Liao D, et al. Adipose-specific peroxisome proliferator-activated receptor gamma knockout causes insulin resistance in fat and liver but not in muscle. Proc Natl Acad Sci U S A. 2003;100(26):15712–15717. - PMC - PubMed
    1. Tontonoz P, Hu E, Graves RA, Budavari AI, Spiegelman BM. mPPAR gamma 2: tissue-specific regulator of an adipocyte enhancer. Genes Dev. 1994;8(10):1224–1234. - PubMed
    1. Gauthier A, Vassiliou G, Benoist F, McPherson R. Adipocyte low density lipoprotein receptor-related protein gene expression and function is regulated by peroxisome proliferator-activated receptor gamma. J Biol Chem. 2003;278(14):11945–11953. - PubMed
    1. Lillis AP, Van Duyn LB, Murphy-Ullrich JE, Strickland DK. LDL receptor-related protein 1: unique tissue-specific functions revealed by selective gene knockout studies. Physiol Rev. 2008;88(3):887–918. - PMC - PubMed

Publication types