. 2009 Oct 13;4(10):e7449.
doi: 10.1371/journal.pone.0007449.

Lacunarity analysis: a promising method for the automated assessment of melanocytic naevi and melanoma

Affiliations

Lacunarity analysis: a promising method for the automated assessment of melanocytic naevi and melanoma

Stephen Gilmore et al. PLoS One. .

Abstract

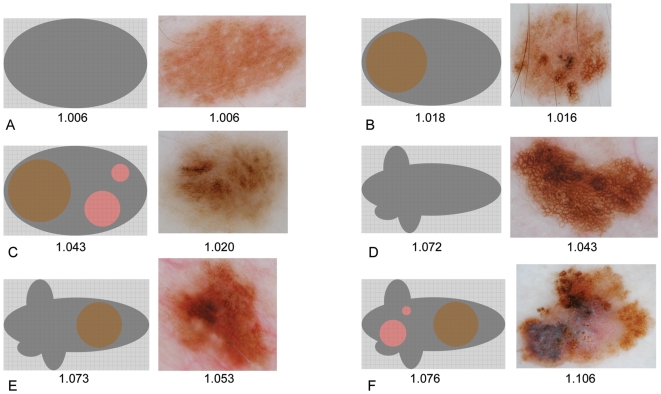
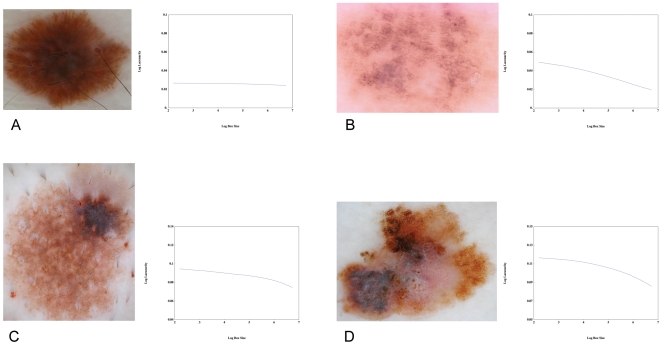
The early diagnosis of melanoma is critical to achieving reduced mortality and increased survival. Although clinical examination is currently the method of choice for melanocytic lesion assessment, there is a growing interest among clinicians regarding the potential diagnostic utility of computerised image analysis. Recognising that there exist significant shortcomings in currently available algorithms, we are motivated to investigate the utility of lacunarity, a simple statistical measure previously used in geology and other fields for the analysis of fractal and multi-scaled images, in the automated assessment of melanocytic naevi and melanoma. Digitised dermoscopic images of 111 benign melanocytic naevi, 99 dysplastic naevi and 102 melanomas were obtained over the period 2003 to 2008, and subject to lacunarity analysis. We found the lacunarity algorithm could accurately distinguish melanoma from benign melanocytic naevi or non-melanoma without introducing many of the limitations associated with other previously reported diagnostic algorithms. Lacunarity analysis suggests an ordering of irregularity in melanocytic lesions, and we suggest the clinical application of this ordering may have utility in the naked-eye dermoscopic diagnosis of early melanoma.


Conflict of interest statement

Competing Interests: The authors have declared that no competing interests exist.

Figures

Figure 1
Figure 1. Lacunarity values as a function of box count and image resolution.
Lacunarity values for the benign naevus (A), dysplastic naevus (B) and melanoma (C) of 100 repeated calculations where the box-counts were 1000 for each (column 2) and as a function of image resolution (column 3). For all plots in column 2 the points cluster about the true value (drawn as a horizontal line) obtained by exhaustive sampling (40,000 box-counts). Note that all data points shown in column 3 lay within the error range shown in column 2. The three native resolution JPEGs, with a minimum axis width of 480 pixels, are shown as the right-most data point of the plots shown in column 3. The lacunarity calculation at this resolution required over 12 hours of CPU time to complete.
Figure 2
Figure 2. Box-plots of lacunarity values for the red spectrum at intermediate maximal box size with respect to diagnostic groups.
Shown are medians, quartiles and 95% quantiles. The dashed line represents the optimal lacunarity value (L = 1.0275) that discriminates between melanoma and non-melanoma. Note the presence of outliers in the dysplastic naevi group.
Figure 3
Figure 3. Receiver Operated Characteristic (ROC) curves.
ROC curves are shown for the lacunarity measure of the red spectrum at maximum box-size equal to one-quarter of the shortest axis of the image. The following pairs are displayed: dysplastic v benign (A), melanoma v benign (B), melanoma v dysplastic (C), and melanoma v non-melanoma (D). Lacunarity can distinguish melanoma from benign naevi (B) with a SE of 92 and a SP of 81, however it does less well in distinguishing melanoma from dysplastic naevi (C), with an optimal SE of 76 and a SP of 54. A SE of 91 and SP of 61 distinguish melanoma from non-melanoma (D) with a discriminatory lacunarity value of 1.0275.
Figure 4
Figure 4. Schematic representation of pigmented lesion irregularity, associated examples, and their monotonically increasing lacunarity values.
For the schematic representations, lacunarity was calculated using normalised red intensity obtained from the respective RGB colour space image. No irregularity (A), simple internal asymmetry (B), hierarchical internal asymmetry (C), boundary asymmetry (D), boundary asymmetry and simple internal asymmetry (E), and boundary asymmetry and hierarchical internal asymmetry (F).
Figure 5
Figure 5. Lacunarity plots.
The utility of lacunarity plots in yielding information about the geometric structure of an image is illustrated by considering the dysplastic naevi (A), (B), (C) and melanoma (D). Lesion A is uniform throughout without any discernable internal heterogeneity hence its corresponding lacunarity curve is straight and flat, indicating a scale-free structure and a fractal dimension very close to 2. Although the lacunarity curve of lesion B is straight, indicating a scale-free structure, the curve slopes downward, indicating a fractal dimension that deviates from 2. Its structure, over the length scale of the plot, is thus fractal. The plot of the dysplastic naevus (C) exhibits a downward inflection where the x-axis equals 5.5, revealing the existence of a prominent single-scale structural element of size ∼e 5.5. = 16 x16 pixels. The melanoma shown in D exhibits significant heterogeneity of structure over many length scales, from the presence of small dark and pale regions to the prominent overall asymmetry. In contrast to A and B, its associated lacunarity curve is not straight because the image is not self-similar, while in contrast to C, a multi-scaled structure is revealed by the prominent curvature and absence of an inflection point. (All plots span the same range of log-lacunarity values, but not necessarily the same values).

References

    1. Ernstoff MS. Melanoma. Screening and education. Clin Plast Surg. 2000;27:317–322. - PubMed
    1. Weinstock MA, Martin RA, Risica PM, et al. Thorough skin examination for the early detection of melanoma. Am J Prev Med. 1999;17:169–175. - PubMed
    1. Argenziano G, Soyer HP. Dermoscopy of pigmented skin lesions – a valuable tool for early diagnosis of melanoma. Lancet Oncol. 2001;2:443–449. - PubMed
    1. Kittler H, Pehamberger H, Wolff K, Binder M. Diagnostic accuracy of dermoscopy. Lancet Oncol. 2002;3:159–165. - PubMed
    1. Argenziano G, Soyer HP, Chimenti S, et al. Dermoscopy of pigmented skin lesions: results of a consensus meeting via the Internet. J Am Acad Dermatol. 2003;48:679–693. - PubMed

Publication types