. 2010 Apr;31(4):604-20.
doi: 10.1002/hbm.20891.

Physical modeling of pulse artefact sources in simultaneous EEG/fMRI

Affiliations

Physical modeling of pulse artefact sources in simultaneous EEG/fMRI

Winston X Yan et al. Hum Brain Mapp. 2010 Apr.

Abstract

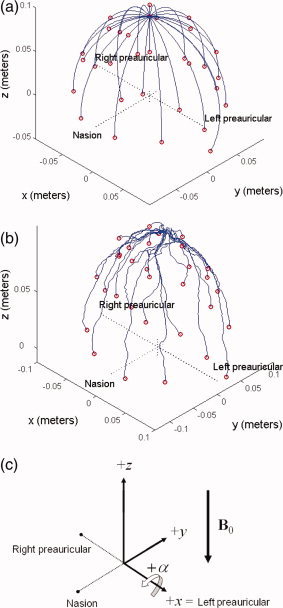
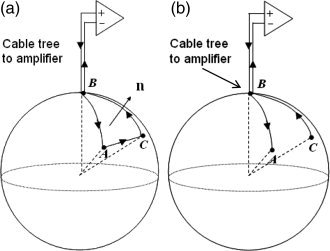
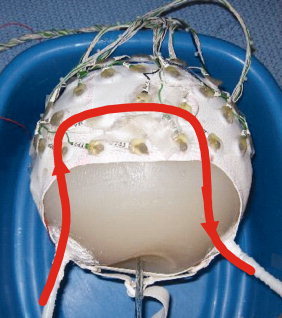
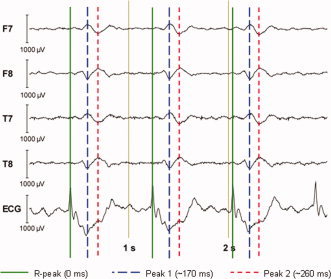
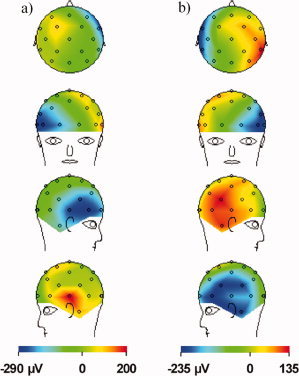
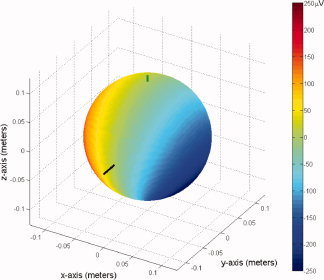
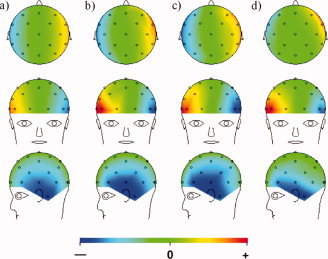
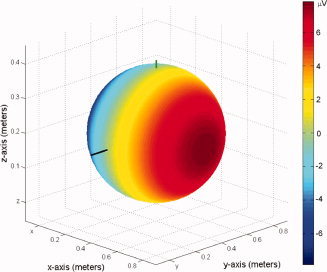
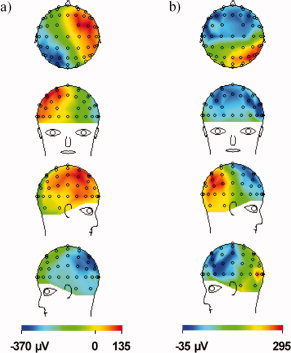
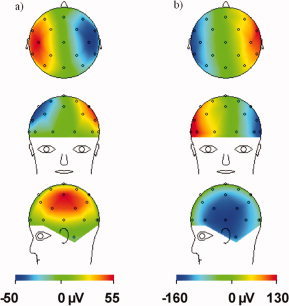
The collection of electroencephalography (EEG) data during simultaneous functional magnetic resonance imaging (fMRI) is impeded by large artefacts in the EEG recordings, with the pulse artefact (PA) being particularly challenging because of its persistence even after application of artefact correction algorithms. Despite several possible causes of the PA having been hypothesized, few studies have rigorously quantified the contributions from the different putative sources. This article presents analytic expressions and simulations describing two possible sources of the PA corresponding to different movements in the strong static field of the MR scanner: cardiac-pulse-driven head rotation and blood-flow-induced Hall voltages. Models of head rotation about a left-right axis and flow in a deep artery running in the anterior-posterior direction reproduced properties of the PA including the left/right spatial variation of polarity. Of these two sources, head rotation was shown to be the most likely source of the PA with simulated magnitudes of >200 muV being generated at 3 T, similar to the in vivo PA magnitudes, for an angular velocity of just 0.5 degrees /s. Smaller artefact voltages of less than 10 muV were calculated for flow in a model artery with physical characteristics similar to the internal carotid artery. A deeper physical understanding of the PA is a key step in working toward production of higher fidelity EEG/fMRI data: analytic expressions for the artefact voltages can guide a redesign of the wiring layout on EEG caps to minimize intrinsic artefact pickup, while simulated artefact maps could be incorporated into selective filters.


Figures

Figure 1
Figure 1
(a) Model 32‐channel EEG cap with purely meridional wires, which was used for the analytic calculations. The co‐ordinate system is defined so that the nasion and preauricular points lie along the principle axes. Electrodes are placed according to the Extended International 10–20 system. The +z‐axis points toward the top of the head, while the −y‐axis points toward the nasion and +x‐axis points toward the left preauricular point. The origin is defined by the intersection of a perpendicular from the nasion to the line between the left and right preauricular points. (b) Wirepaths from an actual EEG cap placed on a spherical phantom, digitized using a Polhemus Isotrak system. (c) Schematic of the coordinate system used in this article, including the direction of the B0 field of the 3 T Philips Achieva MR scanner used for experimental measurements. [Color figure can be viewed in the online issue, which is available at www.interscience.wiley.com.]
Figure 2
Figure 2
Wire loop configuration (a) versus situation that is relevant to EEG (b). In (b), there is not a single defined path from A to C through the conducting sphere, and thus we must calculate the spatially varying potential term induced by the temporally varying magnetic field in order to find the total artefact voltage.
Figure 3
Figure 3
Schematic depicting the approximately U‐shaped conduit in the conducting spherical agar phantom through which saline solution was pumped for an experimental simulation of artefacts from blood flow. [Color figure can be viewed in the online issue, which is available at www.interscience.wiley.com.]
Figure 4
Figure 4
A representative 3‐s EEG trace displaying the BCG artefact measured on a 3 T Philips Achieva MRI scanner (with B 0 field pointing from head to foot) and the timing relationship between the R‐peaks of the ECG and the two subsequent peaks in the individual EEG traces for which the spatial maps displayed in Figure 5. [Color figure can be viewed in the online issue, which is available at www.interscience.wiley.com.]
Figure 5
Figure 5
In vivo spatial voltage map of the BCG artefact measured for a human subject in the 3 T static magnetic field of a Philips Achieva MR Scanner, with the main magnetic field pointing in the head to foot direction. The artefacts are sampled at the two amplitude maxima shown in Figure 4 that follow each ECG R‐peak, with: (a) the first peak at ∼170 ms following the R‐peak and (b) the second peak at ∼260 ms. Note the left/right change in polarity between the maps formed at the two peaks. [Color figure can be viewed in the online issue, which is available at www.interscience.wiley.com.]
Figure 6
Figure 6
Analytic simulation of the artifacts generated by a forward nod of the head of angular velocity 0.44°/s for a 19‐cm diameter sphere, as predicted from a least‐squares fit to the in vivo BCG at the second peak. The long bar indicates the position of the nasion and the smaller bar marks the pole of the sphere, where the simulated “reference” electrode and cable tree are placed. [Color figure can be viewed in the online issue, which is available at www.interscience.wiley.com.]
Figure 7
Figure 7
Comparison of numerically calculated and experimentally measured data for right‐handed rotation about the +x‐axis corresponding to a nod forward of the head: (a) numerical calculation based on leads following lines of longitude; (b) numerical calculation based on digitized real wirepaths; (c) experimental measurement on a conducting spherical agar phantom; (d) experimental measurement on the human head with the subject nodding his head forward. [Color figure can be viewed in the online issue, which is available at www.interscience.wiley.com.]
Figure 8
Figure 8
Analytic simulation of surface potentials generated at 3 T by flowing blood in the posterior‐to‐anterior direction through a vessel modeled after the internal carotid artery, given a 19‐cm sphere, cylindrical flow of 0.5 cm in diameter and 1 cm in length, and flow velocity of 12.6 cm/s in the posterior‐to‐anterior direction. Note that the model is for a Philips Achieva 3 T scanner with magnetic field pointing along the negative z‐axis. [Color figure can be viewed in the online issue, which is available at www.interscience.wiley.com.]
Figure 9
Figure 9
Spatial maps of EEG data for conductive fluid flowing through an approximately U‐shaped conduit inside a conductive spherical agar phantom. The measurement was conducted for continuous flow in the anterior‐to‐posterior (a) and right‐to‐left (b) directions and sampled 5 s after flow onset to avoid movement artefacts. [Color figure can be viewed in the online issue, which is available at www.interscience.wiley.com.]
Figure 10
Figure 10
Decomposition of the rotation artefact (for right‐handed rotation about the x‐axis with an angular velocity of 0.44°/s in a field of 3 T) into contributions from (a) the electrodes and (b) the digitized leads as used in the numerical model. Note the opposite polarity of the two patterns. [Color figure can be viewed in the online issue, which is available at www.interscience.wiley.com.]

References

    1. Allen P, Polizzi G, Krakow K, Fish D, Lemieux L ( 1998): Identification of EEG events in the MR scanner: The problem of pulse artifact and a method for its subtraction. Neuroimage 8: 229–239. - PubMed
    1. Allen P, Josephs O, Turner R ( 2000): A method for removing imaging artifact from continuous EEG recorded during functional MRI. Neuroimage 12: 230–239. - PubMed
    1. Anami K, Saitoh O, Yumoto M, Tanaka F, Kawagoe Y, Ohnishi T, Matsuda H ( 2002): Reduction of ballistocardiogram with a vacuum head‐fixating system during simultaneous fMRI and multi‐channel monopolar EEG recording. Int Congr Ser 1232: 427–431.
    1. Bammer R, Hope T, Aksoy M, Alley M ( 2007): Time‐resolved 3D quantitative flow MRI of the major intracranial vessels: Initial experience and comparative evaluation at 1.5T and 3.0T in combination with parallel imaging. Magn Reson Med 57: 127–140. - PMC - PubMed
    1. Bencsik M, Bowtell R, Bowley R ( 2007): Electric fields induced in the human body by time‐varying magnetic field gradients in MRI: Numerical calculations and correlation analysis. Phys Med Biol 52: 2337–2353. - PubMed