

doi: 10.1186/gb-2009-10-10-r112.
Epub 2009 Oct 13.
Deep short-read sequencing of chromosome 17 from the mouse strains A/J and CAST/Ei identifies significant germline variation and candidate genes that regulate liver triglyceride levels
Affiliations
- PMID: 19825173
- PMCID: PMC2784327
- DOI: 10.1186/gb-2009-10-10-r112
Item in Clipboard
Deep short-read sequencing of chromosome 17 from the mouse strains A/J and CAST/Ei identifies significant germline variation and candidate genes that regulate liver triglyceride levels
Genome Biol.
2009.
Abstract
Genome sequences are essential tools for comparative and mutational analyses. Here we present the short read sequence of mouse chromosome 17 from the Mus musculus domesticus derived strain A/J, and the Mus musculus castaneus derived strain CAST/Ei. We describe approaches for the accurate identification of nucleotide and structural variation in the genomes of vertebrate experimental organisms, and show how these techniques can be applied to help prioritize candidate genes within quantitative trait loci.
Figures
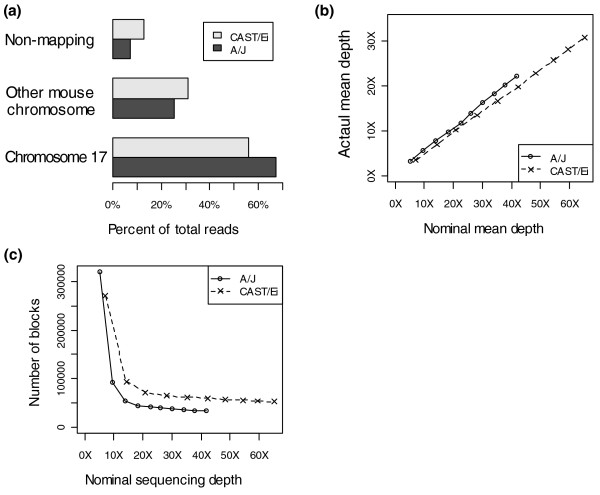
Mapping of short read sequence to the mouse genome. The MAQ algorithm was used to map the short read sequences to the NCBI 37 mouse genome assembly. (a) The percentage of reads that map to chromosome 17, other mouse chromosomes, or not at all to the C57BL/6J reference assembly. (b) The actual average sequence depth over chromosome 17 after duplicate sequence reads have been removed, plotted against the nominal depth if all reads were unique and mapped to chromosome 17. (c) The number of contiguous blocks of sequence, defined as a stretch of sequence where all bases have non-zero sequencing depth over them, plotted against nominal depth (see above).
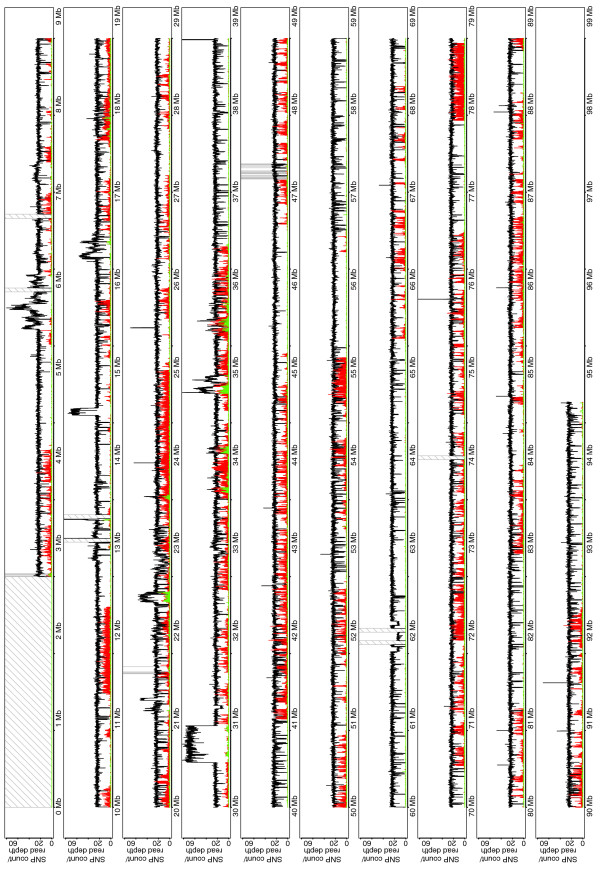
Read depth and SNP density for A/J on chromosome 17. Plot shows depth (black) and density of homozygous (red) and heterozygous (green) SNPs compared to the C57BL/6J reference along chromosome 17. Gray or hashed bars are gaps in the reference assembly.
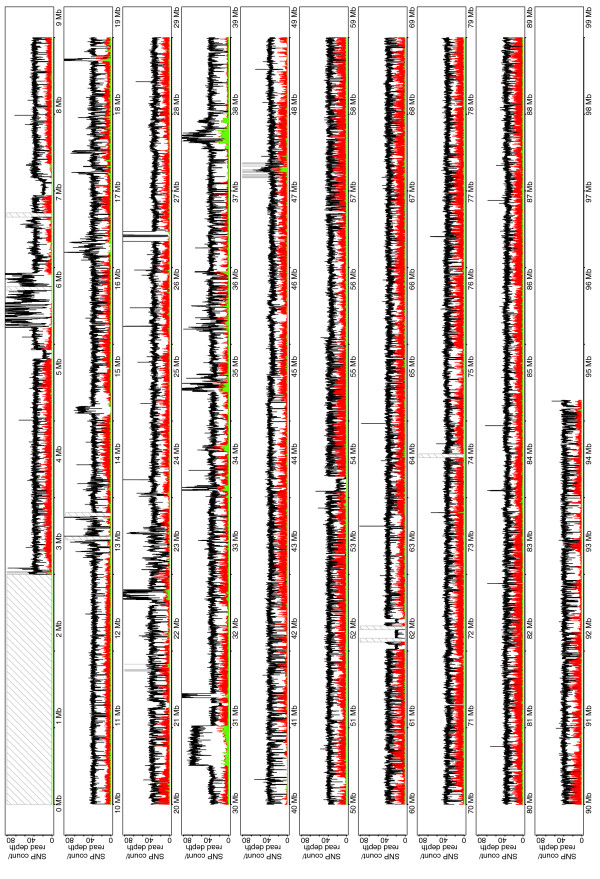
Read depth and SNP density for CAST/Ei on chromosome 17. Plot shows depth (black) and density of homozygous (red) and heterozygous (green) SNPs compared to the C57BL/6J reference along chromosome 17. Gray or hashed bars are gaps in the reference assembly.
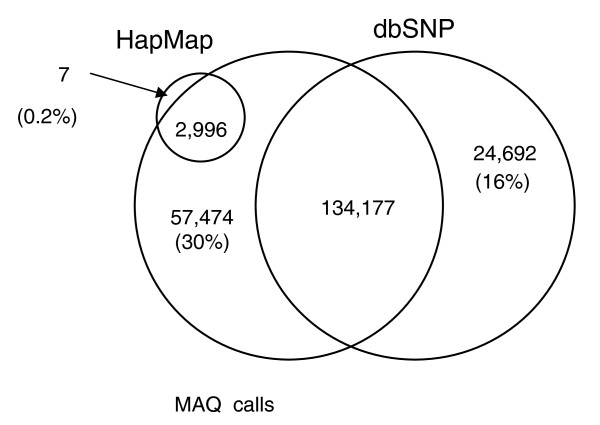
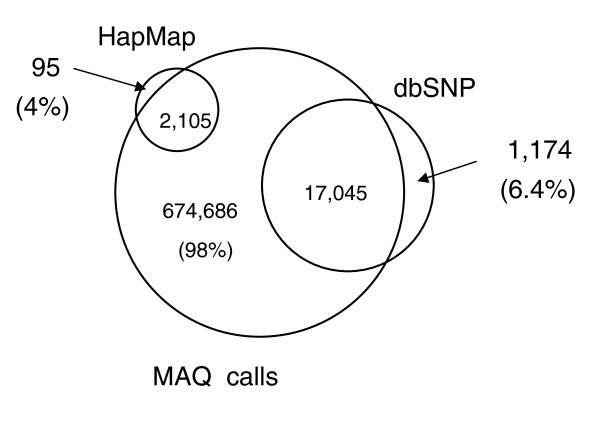
Analysis of SNPs found in A/J sequence. SNPs were called by the MAQ algorithm and then filtered using the MAQ SNP filter. An overlap of SNPs called by MAQ using the A/J Illumina data (MAQ Calls), those present in dbSNP, and those present in the 'Mouse HapMap'.
Analysis of SNPs found in CAST/Ei sequence. SNPs were called by the MAQ algorithm and then filtered using the MAQ SNP filter. The overlap between the SNPs called by MAQ using the CAST/Ei Illumina data (MAQ Calls), those present in dbSNP, and those present in the 'Mouse HapMap'.
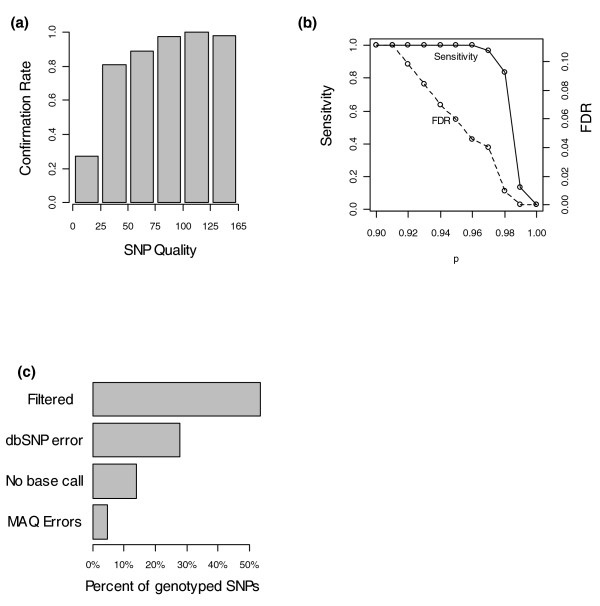
Quality control analysis of novel A/J SNPs. A sample of novel SNPs was genotyped using the Sequenom platform. (a) Plot shows the proportion of calls confirmed by genotyping for differing qualities of SNP. (b) Quality controlling SNPs on basis of mapping depth as well as quality. Confirmation data were used to calculate a score for each SNP based on quality and depth. Plot shows estimated sensitivity and false discovery rate (FDR) based on using different thresholds of p-score. (c) SNPs missed by MAQ. A sample of SNPs present in dbSNP but absent from the MAQ was were genotyped. The reason for the absence of each SNP is shown. 'Filtered' SNPs were called by MAQ but filtered out as being of low quality. 'dbSNP errors' are SNPs where our genotyping agrees with the MAQ call but not dbSNP. 'No base call SNPs' are SNPs for which MAQ did not make a base call (generally due to zero depth). MAQ errors are bases where our genotyping agreed with the dbSNP call.
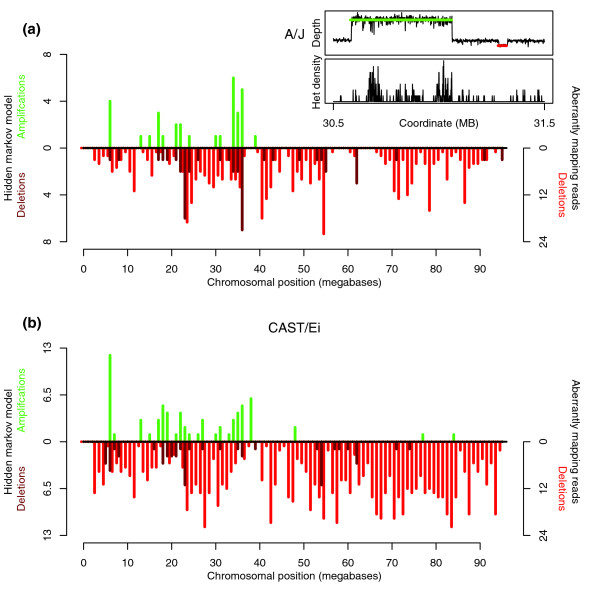
Structural variants on chromosome 17. Copy number variants (CNVs) were called in the sequence using a hidden Markov model (HMM), using both depth information and density of heterozygous SNPs (for amplifications). Deletions were called using aberrantly mapping pairs of reads. (a) Density of CNVs and deletions across chromosome 17 of A/J. CNVs called by the HMM are shown in dark red/green on the left-hand axis. Deletions called from aberrantly mapping read pairs are shown in bright red on the right hand axis. (b) As (a) but for CAST/Ei chromosome 17. Cut-out shows an example of output from the HMM for a region with two amplifications and a loss.
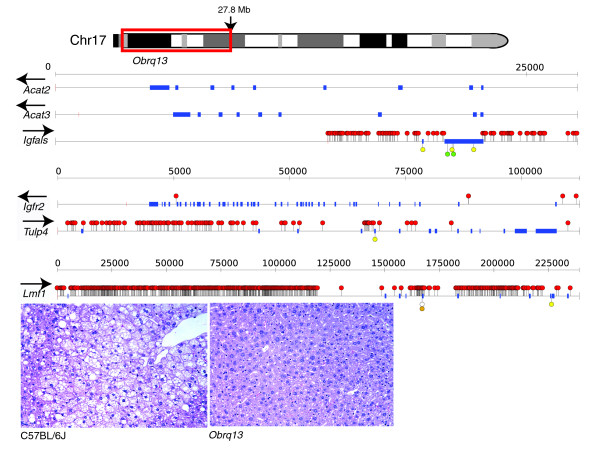
Analysis of SNPs in candidate genes within the Obrq13 QTL region of mouse chromosome 17 that has a protective effect on liver triglyceride levels. Shown is an example of histology of the liver of a C57BL/6J male and a consomic mouse carrying the Obrq13 region from A/J, which has a protective effect on the accumulation of liver triglycerides when animals are placed on a high fat diet [16]. Using the sequence of A/J chromosome 17, we called SNPs against the reference C57BL/6J genome and positioned them in candidate genes within the Obrq13 region. Non-coding SNPs are shown as red circles, non-synonymous SNPs are shown in green, synonymous SNPs are shown in yellow while the truncating and essential splice site SNPs found in a transcript of Lmf1 are shown as an open circle and an orange circle, respectively. The orientation of each gene relative to the forward strain is shown above the gene name as an arrow and genes are grouped together based on size (a scale is shown above each group of genes). Genes are displayed with 5 kb of genomic sequence 5' and 3'.
References
-
- Paigen K. Understanding the human condition: experimental strategies in mammalian genetics. ILAR J. 2002;43:123–135. - PubMed
Publication types
MeSH terms
Substances
Grants and funding
LinkOut - more resources
Full Text Sources
Miscellaneous
